This month, Sailors for the Sea presents a four part blog series based upon the recently issued 3rd National Climate Assessment. Read part one here, and part two here.
Due to human impacts, our global climate is changing predominately because of the emissions we release into the atmosphere when fossil fuels are burned. These changes in our climate are documented around the world, as illustrated in the graph below featuring a progressive rise in the Earth’s average surface temperature.
The last five decades have seen a progressive rise in the Earth’s average surface temperature. Bars show the difference between each decade’s average temperature and the overall average between 1901 through 2000. The far right bar includes data for 2001-2012.
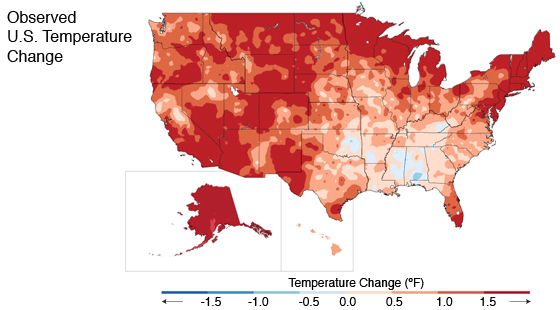
Across the United States, the average temperature has increased by 1.3°F to 1.9°F since record keeping began in 1895 with most of this increase occurring since 1970. Rising temperatures have reduced ice volume and surface extent on land, lakes, and sea, and leading to earlier melting of snow pack. These rising temperatures are also lengthening the growing season and changes in plant hardiness zones.
The map shows temperature changes over the past 22 years (1991-2012) compared to the 1901-1960 average, and compared to the 1951-1980 average for Alaska and Hawai‘i.
While the lack of ice on our waterways could mean more time for boating, increased water temperatures have proven to create more bacteria, algal blooms, and changes in presence of species.
How have scientists’ linked human activities to climate change?
1. How Gases Function We have a fundamental understanding of how certain types of gases trap heat and how the climate system responds to increases in these gases.
2. Studying the Past to Understand the Present Reconstructions from past climates using evidence such as tree rings, ice cores, and corals have showed an increase in carbon dioxide and global temperature. These studies show that global surface temperatures over the last several decades are rising, with the last decade (2000-2009) warmer than any time in at least the last 1,300 years and perhaps much longer.
3. Removing Human Influence Using climate models, scientists have been able to simulate the climate of the past century and separate human and natural factors that influence climate. When the human factors are removed, these models show a marked difference. Only when the human influences are included do the models reproduce the warming observed over the past 50 years.
Heat waves, floods & hurricanes – Oh my!
“Extreme weather events have long proven their ability to wreck havoc on our coasts. Over the last 50 years, much of the U.S. has seen increases in prolonged periods of excessively high temperatures, heavy downpours, and in some regions, severe floods and droughts.” National Climate Assessment, 2014
As the earth gets warmer, extreme weather and climate events are expected to increase. This tends, more often than not, to be the primary way most people experience about climate change. Although it varies by region, as a general rule of thumb, heat waves and downpours are becoming more frequent and intense.
100 days of 100º F weather
Evidence indicates that the human influence on climate has already roughly doubled the probability of extreme heat events. One of the most extreme examples occurred in the summer of 2011 when many locations in Texas and Oklahoma had over 100 days of 100º F weather. Heat waves directly tie into drought events and the “100 days over 100” created $10 billion in direct losses to agriculture alone.
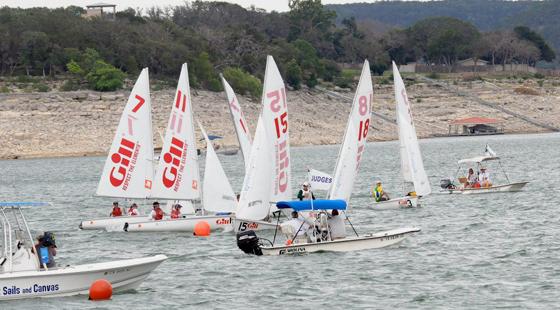
Lake Travis in Austin, TX has been devastated by droughts with water levels decreasing by 61%. The lake is a reservoir for fresh water in the region and a local favorite for boaters. This decrease in water dropped water levels as low as 25 feet below normal, making all marina and dock infrastructure useless.
During the College Sailing Nationals on Lake Travis in 2012, one can see exposed sand behind the boats. When the same event was hosted there in 2005, the home in the background had waterfront property.
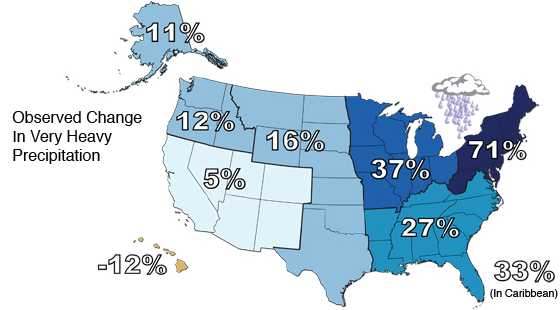
Extreme rain causes significant problems, particularly in urbanized areas. Downpours are increasing nationally and the heaviest rainfall events have become heavier and more frequent. This increase has been greatest in the Northeast, Midwest, and upper Great Plains as seen in the graph below. Heavy downpours lead to poor water quality in lakes and rivers when runoff from our roads (nonpoint source pollution) is washed into the water. Heavy rain events overwhelm sewage systems and in the Great Lakes region, there have been multiple events where the discharge of untreated sewage occurs.
The map shows percent increases in the amount of precipitation falling in very heavy events (defined as the heaviest 1% of all daily events) from 1958 to 2012 for each region of the continental United States. These trends are larger than natural variations for the Northeast, Midwest, Puerto Rico, Southeast, Great Plains, and Alaska. The trends are not larger than natural variations for the Southwest, Hawai‘i, and the Northwest. The changes shown in this figure are calculated from the beginning and end points of the trends for 1958 to 2012.
Heavy downpour events can also lead to floods, another extreme weather event that has been increasing in the United States. It’s worth noting that flooding may intensify in many U.S. regions, even in areas where total precipitation is projected to decline.
“The risks from future floods are significant, given expanded development in coastal areas and floodplains, unabated urbanization, land-use changes, and human-induced climate change.” National Climate Assessment, 2014
Hurricanes
Due to the complex nature of how Hurricanes form, researchers are still unsure of exactly how climate change will affect these super storms. However it has been observed that North Atlantic hurricanes have increased in intensity, frequency, and duration since the early 1980s. By 2100, models, on average, project an increase in the number of Category 4 and 5 hurricanes, and greater rainfall rates in hurricanes in a warmer climate. Additionally, storm surges reach much father inland when combined with sea level rise. Superstorm Sandy was a testament to the mass amount of damage that hurricanes and tropical storms can cause and BoatUS estimated that 25,000 boats were damaged just in New Jersey at a cost of $242 million. Clean up of abandoned boats becomes very expensive with a 30-foot boat costing the state approximately $14,000 to recover.
A Silver Lining?
Current impacts of global warming and extreme weather events can be the most daunting aspects of our changing climate. Preparing for extreme weather events is possible, and it does not just come in the form of evacuation. If we look at past damages, and adapt our coasts to mitigate these impacts – rather than rebuild in the very area that was destroyed, we can reduce the amount of damage before the next storm, flood, or drought occurs. This concept has been coined as “adaptation.”
“Most adaptation efforts to date have occurred at local and regional levels. A survey of 298 U.S. local governments shows 59% engaged in some form of adaptation planning.” National Climate Survey, 2014
Boaters can think globally about the problems of climate change, but it is easy to make a difference in your homeport by acting locally.
What is the National Climate Assessment?
The assessment, which has now been published in its third edition, focuses on our changing climate, highlighting current and future impacts of a warming world. This blog series will focus on topics that will most greatly affect the boating community and response strategies that can help diminish these trends and prepare for change. All graphs and images were pulled from the National Climate Assessment website, unless otherwise noted. To read the full report visit: nca2014.globalchange.gov