This month, Sailors for the Sea presents a four part blog series based upon the recently issued 3rd National Climate Assessment.
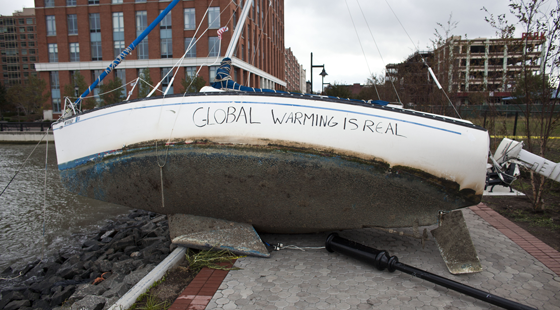
The boating community exists in the boundary where land meets the water and today that boundary’s location is changing due to the effects of global warming.
Whether you hope to watch a future America’s Cup in (potentially) San Francisco where the backup of seawater into the sewage systems is a reoccurring problem, or racing in Miami, FL where the ocean blankets the streets at high tide, global warming is currently impacting boaters all around the United States.
Sea Level Rise
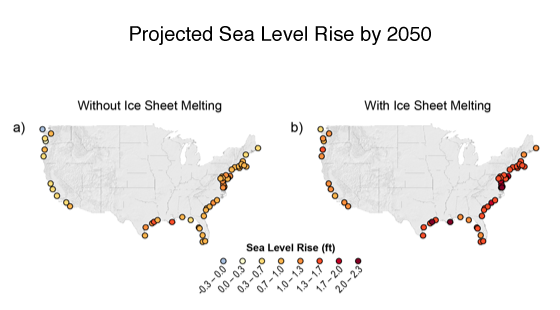
The anticipated sea level rise in the next 36 years varies along the 95,000 miles of U.S. coastline. This rise is anticipated to be up to 2.3 feet in some places, as illustrated in the graph below.
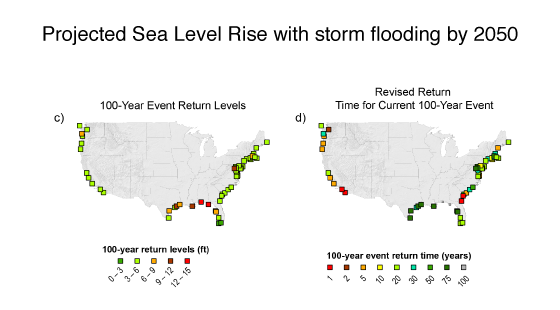
Additionally, potential sea level rise must be assessed with reference to large flooding events and hurricanes that have occurred in the region. Graph c) below shows 100-year event return levels, on top of 1ft of sea level rise and panel d) shows how these “100-year event return levels” will occur more frequently by mid-century, in some regions as often as once a decade or even annually.
Both graphs above take a scientific approach to explaining what many sailors may have started to see at their docks: high tide seems to be getting higher. By 2050 most docks in New England will be exposed to at least a one-foot sea level rise and New Englanders can also expect a Hurricane Sandy like storm every five to thirty years in that same timeframe. Most marina owners, boat owners, and those lucky (or unlucky) enough to have waterfront property will start to see the affects of global warming in their lifetime.
Infrastructure Issues
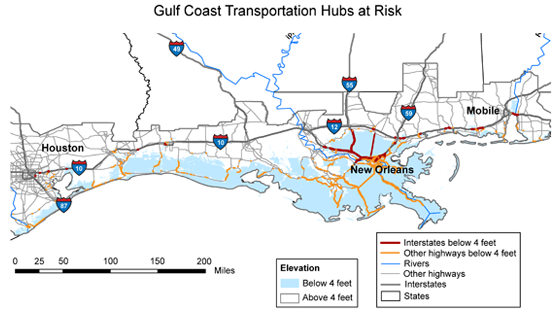
However sea level rise is not just a risk for private property. Much of the infrastructure in our country is along the coast. Our highways – which connect our ports and airports – bring goods from town to town and often hug the coastline. Within this century, every other major roadway in the Gulf Coast region is projected to face inundation by sea level rise. The map below shows roadways at risk in the event of sea level rise on the order of 4 feet, which is within the range of projections for this region by 2100.
If the roads that take us to our sailing centers are underwater, the sailing centers and marinas that dot this region’s coast will need to be moved inland. For example, Southern Yacht Club, founded in 1849, in New Orleans was destroyed in Hurricane Katrina, but is now rebuilt and located well within the flooding on this map.
When infrastructure is damaged the initiative to rebuild is often never questioned. However “planned abandonment” is a growing topic for coastal municipalities. Local governments are being forced to ask, why should we rebuild a structure that’s only going to face an increased risk of hurricanes in the coming years?
It’s all tied together
An important observation from the National Climate Assessment is that much of the infrastructure in our country is tied together. When our power goes out, water treatments systems go down, impacting our local water quality and incidentally, our own health as well.
Response Strategies
The scientists that wrote the National Climate Assessment noted:
“The amount of future climate change will largely be determined by choices society makes about emissions. Lower emissions of heat trapping gases mean less future warming and less severe impacts. Emissions can be reduced through improved energy efficiency and switching to low-carbon or non-carbon energy sources.”
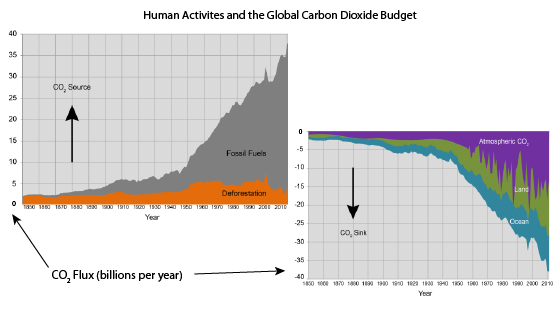
The graph below highlights sources of increased carbon dioxide (CO2) and the increasing amount of carbon being absorbed by the ocean, land and atmosphere. In April 2014, monthly concentrations of CO2 topped 400 parts per million in the atmosphere throughout the northern hemisphere, a level that has not been present while humans have inhabited the earth.
We need to act now to embrace big solutions to big problems that reduce the human carbon footprint.
Above: Human-induced changes in the global carbon dioxide budget roughly since the beginning of the Industrial Revolution. Emissions from fossil fuel burning are the dominant cause of the steep rise shown here from 1850 to 2012.
What is the National Climate Assessment?
The assessment, which has now been published for the third time, focuses on our changing climate, highlighting current and future impacts of a warming world. This blog series will focus on topics that will most greatly affect the boating community and response strategies that can help diminish these trends and prepare for change. All graphs were pulled from the National Climate Assessment website, to read the full report visit: nca2014.globalchange.gov