This month, Sailors for the Sea presents a four part blog series based upon the recently issued 3rd National Climate Assessment.
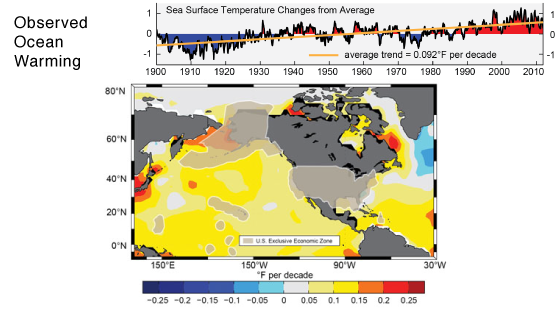
Since 1900, sea surface temperatures for the ocean surrounding the U.S. and its territories have warmed by more than 0.9°F. (top graph). There is significant variation between regions, with the coast of Alaska, for example, warming far more rapidly than other regions (bottom graph).
We are in hot water
The ocean absorbs over 90% of the heat trapped by increasing levels of CO2 and other greenhouse gases in the atmosphere. This excess heat warms and expands the ocean and raises sea level in many parts of the country. Warming waters are also predicted to change ocean currents and circulation. Historical climate observations combined with climate model projections of the future suggest that over the next century the Atlantic Ocean’s overturning circulation – nicknamed the “Ocean Conveyor Belt” – could slow down as a result of climate change, creating far-reaching changes in air temperature and precipitation for Europe, Africa and North America.
“The rise in ocean temperature over the last century will persist into the future, with continued large impacts on climate, ocean circulation, chemistry, and ecosystems.” National Climate Assessment, 2014
Hot water creates habitat loss
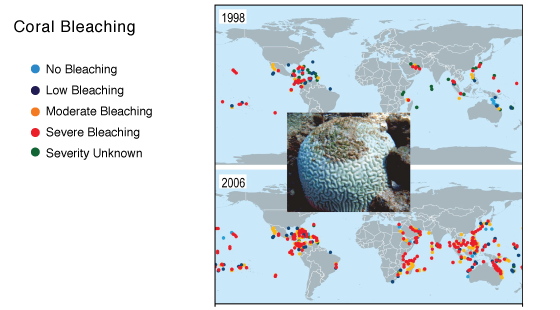
With a 0.9°F rise in sea surface temperatures over the last century, ecosystem change can be seen in many areas of the ocean. In Hawaii and the Caribbean, coral bleaching is a persistent problem and only becoming worse. Coral bleaching occurs when water temperatures become too high, forcing reefs to expel the algae (zooxanthellae) that help nourish them and give them their vibrant color. Coral reefs are essential spawning, nursery, breeding, and feeding grounds, and one of the most diverse ecosystems on the planet.
This can also have far reaching economic impacts for the tourism and marine industry particularly for diving and snorkeling tours. Caribbean coral cover has decreased 80% in less than three decades. The Hawaiian Islands have faired better, but as waters warm the problem expands.
Photo of bleached brain coral. Maps show the global extent and severity of mass coral bleaching with a large increase worldwide over the last decade.
Species Shift North
Unlike coral, marine animals that migrate and swim away have already started to shift their populations north due to warming ocean temperatures. On the east coast, scientists have noticed this trend with lobster, yellowtail flounder, red hake, and summer flounder. As these species move north, other species move in from the south. Tracking this kind of information can inform decisions about how to adapt to climate change, particularly for the fishing industry and management of fish stocks.
Oceans on acid
“The ocean currently absorbs about a quarter of human-caused carbon dioxide emissions to the atmosphere, leading to ocean acidification that will alter marine ecosystems in dramatic yet uncertain ways.” National Climate Assessment, 2014
Since the beginning of the industrial revolution, there has been an approximately 30% increase in surface ocean acidity. Along our coasts, regional differences in ocean pH occur as a result of variability in regional or local conditions. Additionally, coastal waters and estuaries can also exhibit acidification as the result of pollution and excess nutrient inputs, such as fertilizer runoff. Sailors and boaters can help mitigate this by using environmentally safe cleaning products and using compost, rather than toxic fertilizers.
What does this mean?
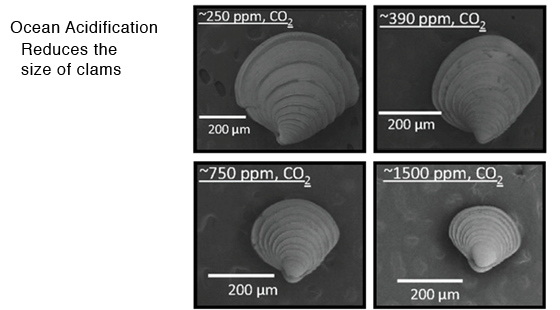
The impacts of ocean acidification are still being explored, but scientists are finding that even creatures at the bottom of the ocean are beginning to experience the effects. Currently the effects of ocean acidification have mostly been seen in creatures that need calcium carbonate to create their shells. This includes clams, oysters, and pteropods.
The state of Washington is one of the regions more vulnerable to ocean acidification. Oyster farms, which were a $110 million dollar industry in the area, have become the poster child to explain the dangers ocean acidification pose to the fishing industry. Researchers have also found that ocean pH level affect the size of a clam, as pictured below.
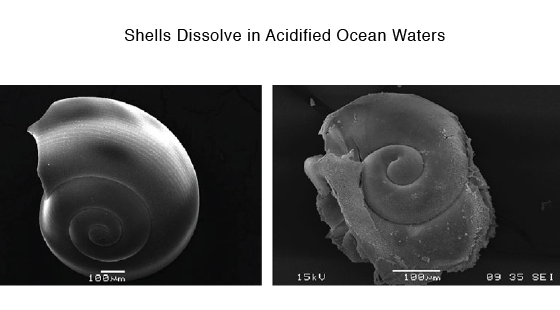
While the immediate threats of ocean acidification seem to lay within the fishing industry, you might call pteropods, small pelagic sea snails that can be found in open ocean and coastal areas, the “canary in the coal mine”. One of the building blocks of life in the ocean, pteropods are consumed by a variety of marine species ranging from tiny krill to whales. As the ocean becomes more acidic, pteropods become unable to build their carbonate shells. Recently scientists have documented this happening in the Southern Ocean.
Many sailors seek solace on the ocean and many have been lucky to see a great variety of wildlife. However humans are changing the way the ocean functions and these tiny pteropods illustrate our species widespread capacity to endanger other species.
The left image shows a shell collected from a live pteropod from a region in the Southern Ocean where acidity is not too high, the right image is from a shell where the water is more acidic.
Coastal Pressures
Today, more than 50% of Americans, 164 million people, live in coastal counties, with 1.2 million added each year. This places heavy demands on the unique natural systems and resources that make our coastal areas so attractive and productive.
“No other region concentrates so many people and so much economic activity on so little land, while also being so relentlessly affected by the sometimes violent interactions of land, sea, and air.” National Climate Assessment, 2014
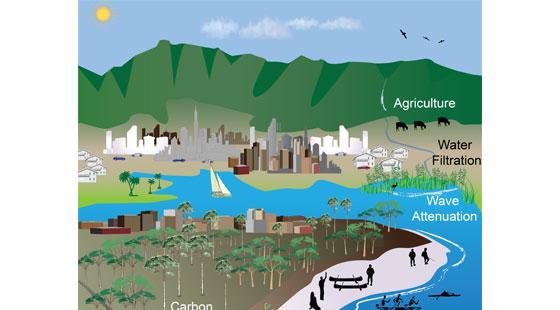
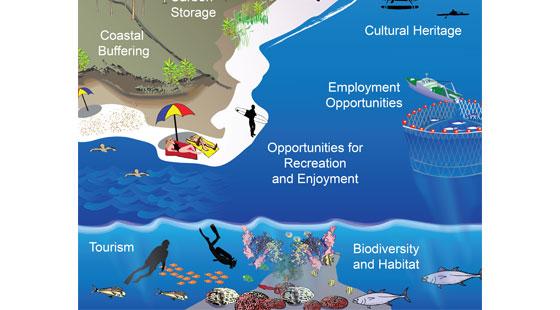
Coastal ecosystems provide many valuable benefits such as reducing flood impacts, buffering from storm surge and waves, providing nursery habitat for important marine species, water filtration, carbon storage, and opportunities for recreation and enjoyment. Coastal ecosystems in the United States have long faced environmental struggles – isn’t it time we start the process of preserving and restoring these vital habitats?
The many important benefits provided by our coastal ecosystems.
Heat impacts on marine plants
Beloved by sailors, Chesapeake Bay is particularly vulnerable to being dramatically altered by global warming. In 2005, a record hot summer almost completely killed off eelgrass in the bay as temperatures exceeded the species’ tolerance threshold of 86°F. Subsequent recovery of eelgrass has been poor since then. While people do not eat eelgrass, it provides many important benefits including habitat for juvenile and adult fish, shellfish along with food for waterfowl, fish, and mammals. It also helps absorb wave energy, nutrients, produce oxygen, and improves water clarity.
Adaptation
For the coastal United States one of the most important pieces of global warming will be preparing to adapt to future changes. The National Climate Assessment notes:
“Climate adaptation efforts that integrate hazard mitigation, natural resource conservation, and restoration of coastal ecosystems can enhance ecological resilience and reduce the exposure of property, infrastructure, and economic activities to climate change impacts.” National Climate Assessment, 2014
As marinas, sailing clubs, and boating centers start to face changes due to global warming, seeking out mitigation and adaptation measures that work in harmony with the environment will help reduce costs over years to come.
What is the National Climate Assessment?
The assessment, which has now been published for the third time, focuses on our changing climate, highlighting current and future impacts of a warming world. This blog series will focus on topics that will most greatly affect the boating community and response strategies that can help diminish these trends and prepare for change. All graphs were pulled from the National Climate Assessment website, to read the full report visit: nca2014.globalchange.gov