LnRiLWNvbnRhaW5lciAudGItY29udGFpbmVyLWlubmVye3dpZHRoOjEwMCU7bWFyZ2luOjAgYXV0b30gLndwLWJsb2NrLXRvb2xzZXQtYmxvY2tzLWNvbnRhaW5lci50Yi1jb250YWluZXJbZGF0YS10b29sc2V0LWJsb2Nrcy1jb250YWluZXI9IjUwZWUyMTY1MTllYzRkYWJkNWZkNmIwMGQ2N2Y4MWRmIl0geyBwYWRkaW5nOiAyNXB4IDI1cHggMHB4IDI1cHg7IH0gLndwLWJsb2NrLXRvb2xzZXQtYmxvY2tzLWNvbnRhaW5lci50Yi1jb250YWluZXJbZGF0YS10b29sc2V0LWJsb2Nrcy1jb250YWluZXI9IjUwZWUyMTY1MTllYzRkYWJkNWZkNmIwMGQ2N2Y4MWRmIl0gPiAudGItY29udGFpbmVyLWlubmVyIHsgbWF4LXdpZHRoOiAxMjAwcHg7IH0gLnRiLWNvbnRhaW5lciAudGItY29udGFpbmVyLWlubmVye3dpZHRoOjEwMCU7bWFyZ2luOjAgYXV0b30gLndwLWJsb2NrLXRvb2xzZXQtYmxvY2tzLWNvbnRhaW5lci50Yi1jb250YWluZXJbZGF0YS10b29sc2V0LWJsb2Nrcy1jb250YWluZXI9Ijk0MWY3MWY2YWY1MDk0MjNmMzlkMGE1M2RlNjg0MzE2Il0geyBiYWNrZ3JvdW5kOiByZ2JhKCAyNTUsIDI1NSwgMjU1LCAxICk7cGFkZGluZzogNDVweDttYXJnaW4tdG9wOiAtMTAwcHg7Ym94LXNoYWRvdzogMXB4IC0xcHggMTBweCAwIHJnYmEoIDAsIDAsIDAsIDAuNSApO21pbi1oZWlnaHQ6IDYwMHB4OyB9IC50Yi1jb250YWluZXIgLnRiLWNvbnRhaW5lci1pbm5lcnt3aWR0aDoxMDAlO21hcmdpbjowIGF1dG99IC53cC1ibG9jay10b29sc2V0LWJsb2Nrcy1jb250YWluZXIudGItY29udGFpbmVyW2RhdGEtdG9vbHNldC1ibG9ja3MtY29udGFpbmVyPSIzZmNkODI0ZGMxNzQ0ZjY3NGJhYTExOWUzMGI2ZWUyNSJdIHsgYmFja2dyb3VuZDogcmdiYSggOTMsIDE3MywgMTk2LCAxICk7cGFkZGluZzogMjVweDsgfSAudGItZ3JpZCwudGItZ3JpZD4uYmxvY2stZWRpdG9yLWlubmVyLWJsb2Nrcz4uYmxvY2stZWRpdG9yLWJsb2NrLWxpc3RfX2xheW91dHtkaXNwbGF5OmdyaWQ7Z3JpZC1yb3ctZ2FwOjI1cHg7Z3JpZC1jb2x1bW4tZ2FwOjI1cHh9LnRiLWdyaWQtaXRlbXtiYWNrZ3JvdW5kOiNkMzhhMDM7cGFkZGluZzozMHB4fS50Yi1ncmlkLWNvbHVtbntmbGV4LXdyYXA6d3JhcH0udGItZ3JpZC1jb2x1bW4+Knt3aWR0aDoxMDAlfS50Yi1ncmlkLWNvbHVtbi50Yi1ncmlkLWFsaWduLXRvcHt3aWR0aDoxMDAlO2Rpc3BsYXk6ZmxleDthbGlnbi1jb250ZW50OmZsZXgtc3RhcnR9LnRiLWdyaWQtY29sdW1uLnRiLWdyaWQtYWxpZ24tY2VudGVye3dpZHRoOjEwMCU7ZGlzcGxheTpmbGV4O2FsaWduLWNvbnRlbnQ6Y2VudGVyfS50Yi1ncmlkLWNvbHVtbi50Yi1ncmlkLWFsaWduLWJvdHRvbXt3aWR0aDoxMDAlO2Rpc3BsYXk6ZmxleDthbGlnbi1jb250ZW50OmZsZXgtZW5kfSAud3AtYmxvY2stdG9vbHNldC1ibG9ja3MtZ3JpZC50Yi1ncmlkW2RhdGEtdG9vbHNldC1ibG9ja3MtZ3JpZD0iMTRlYzhhY2ZiYzY0YWY4ODg2Nzg5MGQ3OGFmNTY4YzkiXSB7IGdyaWQtdGVtcGxhdGUtY29sdW1uczogbWlubWF4KDAsIDAuMzM1ZnIpIG1pbm1heCgwLCAwLjY2NWZyKTtncmlkLWF1dG8tZmxvdzogcm93IH0gLndwLWJsb2NrLXRvb2xzZXQtYmxvY2tzLWdyaWQudGItZ3JpZFtkYXRhLXRvb2xzZXQtYmxvY2tzLWdyaWQ9IjE0ZWM4YWNmYmM2NGFmODg4Njc4OTBkNzhhZjU2OGM5Il0gPiAudGItZ3JpZC1jb2x1bW46bnRoLW9mLXR5cGUoMm4gKyAxKSB7IGdyaWQtY29sdW1uOiAxIH0gLndwLWJsb2NrLXRvb2xzZXQtYmxvY2tzLWdyaWQudGItZ3JpZFtkYXRhLXRvb2xzZXQtYmxvY2tzLWdyaWQ9IjE0ZWM4YWNmYmM2NGFmODg4Njc4OTBkNzhhZjU2OGM5Il0gPiAudGItZ3JpZC1jb2x1bW46bnRoLW9mLXR5cGUoMm4gKyAyKSB7IGdyaWQtY29sdW1uOiAyIH0gLnRiLWZpZWxkcy1hbmQtdGV4dFtkYXRhLXRvb2xzZXQtYmxvY2tzLWZpZWxkcy1hbmQtdGV4dD0iNDY3MDMzZjZmOWI1YTMwZDdhMGJlYzdjYjJiMzgyYTUiXSB7IGZvbnQtc2l6ZTogMTZweDtsaW5lLWhlaWdodDogNDBweDtjb2xvcjogcmdiYSggMjU1LCAyNTUsIDI1NSwgMSApO21hcmdpbi10b3A6IDQwcHg7IH0gLnRiLWZpZWxkcy1hbmQtdGV4dFtkYXRhLXRvb2xzZXQtYmxvY2tzLWZpZWxkcy1hbmQtdGV4dD0iNDY3MDMzZjZmOWI1YTMwZDdhMGJlYzdjYjJiMzgyYTUiXSBwIHsgZm9udC1zaXplOiAxNnB4O2xpbmUtaGVpZ2h0OiA0MHB4O2NvbG9yOiByZ2JhKCAyNTUsIDI1NSwgMjU1LCAxICk7IH0gLndwLWJsb2NrLXRvb2xzZXQtYmxvY2tzLWdyaWQtY29sdW1uLnRiLWdyaWQtY29sdW1uW2RhdGEtdG9vbHNldC1ibG9ja3MtZ3JpZC1jb2x1bW49IjMwMzRmYmU4ODZjMTEwNTRlOTViNDZiMDlkM2U0MTEyIl0geyBkaXNwbGF5OiBmbGV4OyB9IC50Yi1jb250YWluZXIgLnRiLWNvbnRhaW5lci1pbm5lcnt3aWR0aDoxMDAlO21hcmdpbjowIGF1dG99IC53cC1ibG9jay10b29sc2V0LWJsb2Nrcy1jb250YWluZXIudGItY29udGFpbmVyW2RhdGEtdG9vbHNldC1ibG9ja3MtY29udGFpbmVyPSJlZDM4MzJhYTYyMDFjYmVjNWIxZTViOTAyZGMwNjdlMiJdIHsgcGFkZGluZzogMjVweDsgfSAudGItaGVhZGluZ1tkYXRhLXRvb2xzZXQtYmxvY2tzLWhlYWRpbmc9ImU3NmFkMWRiZWY2ZTEzNmJjZDcyMGIxYTM1ZjFlZGIzIl0gIHsgZm9udC1zaXplOiAyMHB4O2NvbG9yOiByZ2JhKCAyNTUsIDI1NSwgMjU1LCAxICk7bWFyZ2luLXRvcDogMTVweDsgfSAgLnRiLWltYWdle3Bvc2l0aW9uOnJlbGF0aXZlO3RyYW5zaXRpb246dHJhbnNmb3JtIDAuMjVzIGVhc2V9LndwLWJsb2NrLWltYWdlIC50Yi1pbWFnZS5hbGlnbmNlbnRlcnttYXJnaW4tbGVmdDphdXRvO21hcmdpbi1yaWdodDphdXRvfS50Yi1pbWFnZSBpbWd7bWF4LXdpZHRoOjEwMCU7aGVpZ2h0OmF1dG87d2lkdGg6YXV0bzt0cmFuc2l0aW9uOnRyYW5zZm9ybSAwLjI1cyBlYXNlfS50Yi1pbWFnZSAudGItaW1hZ2UtY2FwdGlvbi1maXQtdG8taW1hZ2V7ZGlzcGxheTp0YWJsZX0udGItaW1hZ2UgLnRiLWltYWdlLWNhcHRpb24tZml0LXRvLWltYWdlIC50Yi1pbWFnZS1jYXB0aW9ue2Rpc3BsYXk6dGFibGUtY2FwdGlvbjtjYXB0aW9uLXNpZGU6Ym90dG9tfSAud3AtYmxvY2staW1hZ2UudGItaW1hZ2VbZGF0YS10b29sc2V0LWJsb2Nrcy1pbWFnZT0iNzRkZWZlMmM0NDRlMWEwMWQ1MjY2YjJiMjZjZmVkZDMiXSB7IG1heC13aWR0aDogMTAwJTsgfSAudGItZ3JpZCwudGItZ3JpZD4uYmxvY2stZWRpdG9yLWlubmVyLWJsb2Nrcz4uYmxvY2stZWRpdG9yLWJsb2NrLWxpc3RfX2xheW91dHtkaXNwbGF5OmdyaWQ7Z3JpZC1yb3ctZ2FwOjI1cHg7Z3JpZC1jb2x1bW4tZ2FwOjI1cHh9LnRiLWdyaWQtaXRlbXtiYWNrZ3JvdW5kOiNkMzhhMDM7cGFkZGluZzozMHB4fS50Yi1ncmlkLWNvbHVtbntmbGV4LXdyYXA6d3JhcH0udGItZ3JpZC1jb2x1bW4+Knt3aWR0aDoxMDAlfS50Yi1ncmlkLWNvbHVtbi50Yi1ncmlkLWFsaWduLXRvcHt3aWR0aDoxMDAlO2Rpc3BsYXk6ZmxleDthbGlnbi1jb250ZW50OmZsZXgtc3RhcnR9LnRiLWdyaWQtY29sdW1uLnRiLWdyaWQtYWxpZ24tY2VudGVye3dpZHRoOjEwMCU7ZGlzcGxheTpmbGV4O2FsaWduLWNvbnRlbnQ6Y2VudGVyfS50Yi1ncmlkLWNvbHVtbi50Yi1ncmlkLWFsaWduLWJvdHRvbXt3aWR0aDoxMDAlO2Rpc3BsYXk6ZmxleDthbGlnbi1jb250ZW50OmZsZXgtZW5kfSAud3AtYmxvY2stdG9vbHNldC1ibG9ja3MtZ3JpZC50Yi1ncmlkW2RhdGEtdG9vbHNldC1ibG9ja3MtZ3JpZD0iNGI1NWFkZjFkMzMxZjQ5NmY4YTNiNzliYzU5MDA3MzAiXSB7IGdyaWQtdGVtcGxhdGUtY29sdW1uczogbWlubWF4KDAsIDAuODA1ZnIpIG1pbm1heCgwLCAwLjE5NWZyKTtncmlkLWF1dG8tZmxvdzogcm93IH0gLndwLWJsb2NrLXRvb2xzZXQtYmxvY2tzLWdyaWQudGItZ3JpZFtkYXRhLXRvb2xzZXQtYmxvY2tzLWdyaWQ9IjRiNTVhZGYxZDMzMWY0OTZmOGEzYjc5YmM1OTAwNzMwIl0gPiAudGItZ3JpZC1jb2x1bW46bnRoLW9mLXR5cGUoMm4gKyAxKSB7IGdyaWQtY29sdW1uOiAxIH0gLndwLWJsb2NrLXRvb2xzZXQtYmxvY2tzLWdyaWQudGItZ3JpZFtkYXRhLXRvb2xzZXQtYmxvY2tzLWdyaWQ9IjRiNTVhZGYxZDMzMWY0OTZmOGEzYjc5YmM1OTAwNzMwIl0gPiAudGItZ3JpZC1jb2x1bW46bnRoLW9mLXR5cGUoMm4gKyAyKSB7IGdyaWQtY29sdW1uOiAyIH0gLndwLWJsb2NrLXRvb2xzZXQtYmxvY2tzLWdyaWQtY29sdW1uLnRiLWdyaWQtY29sdW1uW2RhdGEtdG9vbHNldC1ibG9ja3MtZ3JpZC1jb2x1bW49IjZlMDhkMWY2ZDNjYzgxNzQzYmRkMDZjYjhmOGNiZTNiIl0geyBwYWRkaW5nLXRvcDogMjVweDtkaXNwbGF5OiBmbGV4OyB9IC50Yi1jb250YWluZXIgLnRiLWNvbnRhaW5lci1pbm5lcnt3aWR0aDoxMDAlO21hcmdpbjowIGF1dG99IC53cC1ibG9jay10b29sc2V0LWJsb2Nrcy1jb250YWluZXIudGItY29udGFpbmVyW2RhdGEtdG9vbHNldC1ibG9ja3MtY29udGFpbmVyPSI3NmI5ZTE5YWViZDc4YjQ2N2IwNGM2NGFjZmUzMzE2NyJdIHsgcGFkZGluZzogMHB4OyB9IGgyLnRiLWhlYWRpbmdbZGF0YS10b29sc2V0LWJsb2Nrcy1oZWFkaW5nPSI0YzllYTlkNDYyZGI0MWZhOThhYzNjN2U1MTNhYjhmNiJdICB7IGZvbnQtc2l6ZTogMTZweDt0ZXh0LWRlY29yYXRpb246IG5vbmU7IH0gIGgyLnRiLWhlYWRpbmdbZGF0YS10b29sc2V0LWJsb2Nrcy1oZWFkaW5nPSJjOWZhZDk4NmFmMGQ0M2IwNTFhN2EzZGNlYWQyNjk0MSJdICB7IGZvbnQtc2l6ZTogMThweDtjb2xvcjogcmdiYSggMzQsIDg0LCAxMTgsIDEgKTt0ZXh0LWFsaWduOiBjZW50ZXI7bWFyZ2luLXRvcDogMTBweDsgfSAgLnRiLWltYWdle3Bvc2l0aW9uOnJlbGF0aXZlO3RyYW5zaXRpb246dHJhbnNmb3JtIDAuMjVzIGVhc2V9LndwLWJsb2NrLWltYWdlIC50Yi1pbWFnZS5hbGlnbmNlbnRlcnttYXJnaW4tbGVmdDphdXRvO21hcmdpbi1yaWdodDphdXRvfS50Yi1pbWFnZSBpbWd7bWF4LXdpZHRoOjEwMCU7aGVpZ2h0OmF1dG87d2lkdGg6YXV0bzt0cmFuc2l0aW9uOnRyYW5zZm9ybSAwLjI1cyBlYXNlfS50Yi1pbWFnZSAudGItaW1hZ2UtY2FwdGlvbi1maXQtdG8taW1hZ2V7ZGlzcGxheTp0YWJsZX0udGItaW1hZ2UgLnRiLWltYWdlLWNhcHRpb24tZml0LXRvLWltYWdlIC50Yi1pbWFnZS1jYXB0aW9ue2Rpc3BsYXk6dGFibGUtY2FwdGlvbjtjYXB0aW9uLXNpZGU6Ym90dG9tfSAud3AtYmxvY2staW1hZ2UudGItaW1hZ2VbZGF0YS10b29sc2V0LWJsb2Nrcy1pbWFnZT0iM2RhYWViMzdjMGZmYjA3MDVjNGViMWVkNTBlOGQ5MzUiXSB7IG1heC13aWR0aDogMTAwJTsgfSAud3AtYmxvY2stdG9vbHNldC1ibG9ja3MtZ3JpZC1jb2x1bW4udGItZ3JpZC1jb2x1bW5bZGF0YS10b29sc2V0LWJsb2Nrcy1ncmlkLWNvbHVtbj0iMTRlYjU5OGM0NTczOTM2YzYxZDQ0MTU5ZDVlZWE0NDIiXSB7IGRpc3BsYXk6IGZsZXg7IH0gLnRiLWZpZWxkcy1hbmQtdGV4dFtkYXRhLXRvb2xzZXQtYmxvY2tzLWZpZWxkcy1hbmQtdGV4dD0iMDVjNzEyYTVhMjJiNTlkZjFiZTRkMjg0ODcwNWQzMzUiXSB7IGZvbnQtc2l6ZTogMjRweDtsaW5lLWhlaWdodDogNDBweDtjb2xvcjogcmdiYSggMzQsIDg0LCAxMTgsIDEgKTsgfSAudGItZmllbGRzLWFuZC10ZXh0W2RhdGEtdG9vbHNldC1ibG9ja3MtZmllbGRzLWFuZC10ZXh0PSIwNWM3MTJhNWEyMmI1OWRmMWJlNGQyODQ4NzA1ZDMzNSJdIHAgeyBmb250LXNpemU6IDI0cHg7bGluZS1oZWlnaHQ6IDQwcHg7Y29sb3I6IHJnYmEoIDM0LCA4NCwgMTE4LCAxICk7IH0gLnRiLWNvbnRhaW5lciAudGItY29udGFpbmVyLWlubmVye3dpZHRoOjEwMCU7bWFyZ2luOjAgYXV0b30gLndwLWJsb2NrLXRvb2xzZXQtYmxvY2tzLWNvbnRhaW5lci50Yi1jb250YWluZXJbZGF0YS10b29sc2V0LWJsb2Nrcy1jb250YWluZXI9ImEyMWI5OTg4MDg3MjNjOGFiMzU4MWNkMzIwM2ZiYmUzIl0geyBiYWNrZ3JvdW5kOmxpbmVhci1ncmFkaWVudChyZ2JhKCAwLCAwLCAwLCAwLjMyICkscmdiYSggMCwgMCwgMCwgMC4zMiApKSwgIHJnYmEoIDI1NSwgMjU1LCAyNTUsIDAgKSB1cmwoJycpIGNlbnRlciBjZW50ZXIgbm8tcmVwZWF0O2JhY2tncm91bmQtc2l6ZTphdXRvLCBjb3ZlcjtwYWRkaW5nOiAyNXB4O21hcmdpbi10b3A6IC01MDBweDttaW4taGVpZ2h0OiA1MDBweDtkaXNwbGF5Om1zLWZsZXhib3ggIWltcG9ydGFudDtkaXNwbGF5OmZsZXggIWltcG9ydGFudDstbXMtZmxleC1kaXJlY3Rpb246Y29sdW1uO2ZsZXgtZGlyZWN0aW9uOmNvbHVtbjstbXMtZmxleC1wYWNrOmNlbnRlcjtqdXN0aWZ5LWNvbnRlbnQ6Y2VudGVyOyB9IC53cC1ibG9jay10b29sc2V0LWJsb2Nrcy1jb250YWluZXIudGItY29udGFpbmVyW2RhdGEtdG9vbHNldC1ibG9ja3MtY29udGFpbmVyPSJhMjFiOTk4ODA4NzIzYzhhYjM1ODFjZDMyMDNmYmJlMyJdID4gLnRiLWNvbnRhaW5lci1pbm5lciB7IG1heC13aWR0aDogMTIwMHB4OyB9IC53cC1ibG9jay10b29sc2V0LWJsb2Nrcy1jb250YWluZXIudGItY29udGFpbmVyW2RhdGEtdG9vbHNldC1ibG9ja3MtY29udGFpbmVyPSJhMjFiOTk4ODA4NzIzYzhhYjM1ODFjZDMyMDNmYmJlMyJdIHAgeyBsZXR0ZXItc3BhY2luZzogMHB4OyB9IC50Yi1maWVsZHMtYW5kLXRleHRbZGF0YS10b29sc2V0LWJsb2Nrcy1maWVsZHMtYW5kLXRleHQ9ImVkMzgwMWMyMjk1ZDQ1N2E0MTg3NzdjMzgyNGRmMWIzIl0geyBmb250LXNpemU6IDIwcHg7Y29sb3I6IHJnYmEoIDI1NSwgMjU1LCAyNTUsIDEgKTsgfSAudGItZmllbGRzLWFuZC10ZXh0W2RhdGEtdG9vbHNldC1ibG9ja3MtZmllbGRzLWFuZC10ZXh0PSJlZDM4MDFjMjI5NWQ0NTdhNDE4Nzc3YzM4MjRkZjFiMyJdIHAgeyBmb250LXNpemU6IDIwcHg7Y29sb3I6IHJnYmEoIDI1NSwgMjU1LCAyNTUsIDEgKTsgfSBoMS50Yi1oZWFkaW5nW2RhdGEtdG9vbHNldC1ibG9ja3MtaGVhZGluZz0iNzgyZDFmYThiODY3Y2VlM2UyNjk3ODE3ZTE4NzJhZGEiXSAgeyBmb250LXNpemU6IDY0cHg7bGluZS1oZWlnaHQ6IDUycHg7bGV0dGVyLXNwYWNpbmc6IDBweDt0ZXh0LXRyYW5zZm9ybTogdXBwZXJjYXNlO2NvbG9yOiByZ2JhKCAyNTUsIDI1NSwgMjU1LCAxICk7dGV4dC1hbGlnbjogY2VudGVyO3BhZGRpbmctdG9wOiAwcHg7cGFkZGluZy1ib3R0b206IDBweDttYXJnaW4tdG9wOiA3NXB4O21hcmdpbi1ib3R0b206IDBweDsgfSAgLnRiLWNvbnRhaW5lciAudGItY29udGFpbmVyLWlubmVye3dpZHRoOjEwMCU7bWFyZ2luOjAgYXV0b30gLndwLWJsb2NrLXRvb2xzZXQtYmxvY2tzLWNvbnRhaW5lci50Yi1jb250YWluZXJbZGF0YS10b29sc2V0LWJsb2Nrcy1jb250YWluZXI9IjM2NjdlNzYzMWM0MjhjNzA0YjI5NjdiZGJhNzAxYTJiIl0geyBiYWNrZ3JvdW5kOmxpbmVhci1ncmFkaWVudChyZ2JhKCAyNTUsIDI1NSwgMjU1LCAwICkscmdiYSggMjU1LCAyNTUsIDI1NSwgMCApKSwgIHJnYmEoIDAsIDAsIDAsIDEgKSB1cmwoJycpIGNlbnRlciB0b3Agbm8tcmVwZWF0O2JhY2tncm91bmQtc2l6ZTphdXRvLCBjb3ZlcjtwYWRkaW5nOiAwcHg7bWFyZ2luOiAwcHg7bWluLWhlaWdodDogNTAwcHg7IH0gQG1lZGlhIG9ubHkgc2NyZWVuIGFuZCAobWF4LXdpZHRoOiA3ODFweCkgeyAudGItY29udGFpbmVyIC50Yi1jb250YWluZXItaW5uZXJ7d2lkdGg6MTAwJTttYXJnaW46MCBhdXRvfS50Yi1jb250YWluZXIgLnRiLWNvbnRhaW5lci1pbm5lcnt3aWR0aDoxMDAlO21hcmdpbjowIGF1dG99LnRiLWNvbnRhaW5lciAudGItY29udGFpbmVyLWlubmVye3dpZHRoOjEwMCU7bWFyZ2luOjAgYXV0b30udGItZ3JpZCwudGItZ3JpZD4uYmxvY2stZWRpdG9yLWlubmVyLWJsb2Nrcz4uYmxvY2stZWRpdG9yLWJsb2NrLWxpc3RfX2xheW91dHtkaXNwbGF5OmdyaWQ7Z3JpZC1yb3ctZ2FwOjI1cHg7Z3JpZC1jb2x1bW4tZ2FwOjI1cHh9LnRiLWdyaWQtaXRlbXtiYWNrZ3JvdW5kOiNkMzhhMDM7cGFkZGluZzozMHB4fS50Yi1ncmlkLWNvbHVtbntmbGV4LXdyYXA6d3JhcH0udGItZ3JpZC1jb2x1bW4+Knt3aWR0aDoxMDAlfS50Yi1ncmlkLWNvbHVtbi50Yi1ncmlkLWFsaWduLXRvcHt3aWR0aDoxMDAlO2Rpc3BsYXk6ZmxleDthbGlnbi1jb250ZW50OmZsZXgtc3RhcnR9LnRiLWdyaWQtY29sdW1uLnRiLWdyaWQtYWxpZ24tY2VudGVye3dpZHRoOjEwMCU7ZGlzcGxheTpmbGV4O2FsaWduLWNvbnRlbnQ6Y2VudGVyfS50Yi1ncmlkLWNvbHVtbi50Yi1ncmlkLWFsaWduLWJvdHRvbXt3aWR0aDoxMDAlO2Rpc3BsYXk6ZmxleDthbGlnbi1jb250ZW50OmZsZXgtZW5kfSAud3AtYmxvY2stdG9vbHNldC1ibG9ja3MtZ3JpZC50Yi1ncmlkW2RhdGEtdG9vbHNldC1ibG9ja3MtZ3JpZD0iMTRlYzhhY2ZiYzY0YWY4ODg2Nzg5MGQ3OGFmNTY4YzkiXSB7IGdyaWQtdGVtcGxhdGUtY29sdW1uczogbWlubWF4KDAsIDAuNWZyKSBtaW5tYXgoMCwgMC41ZnIpO2dyaWQtYXV0by1mbG93OiByb3cgfSAud3AtYmxvY2stdG9vbHNldC1ibG9ja3MtZ3JpZC50Yi1ncmlkW2RhdGEtdG9vbHNldC1ibG9ja3MtZ3JpZD0iMTRlYzhhY2ZiYzY0YWY4ODg2Nzg5MGQ3OGFmNTY4YzkiXSA+IC50Yi1ncmlkLWNvbHVtbjpudGgtb2YtdHlwZSgybiArIDEpIHsgZ3JpZC1jb2x1bW46IDEgfSAud3AtYmxvY2stdG9vbHNldC1ibG9ja3MtZ3JpZC50Yi1ncmlkW2RhdGEtdG9vbHNldC1ibG9ja3MtZ3JpZD0iMTRlYzhhY2ZiYzY0YWY4ODg2Nzg5MGQ3OGFmNTY4YzkiXSA+IC50Yi1ncmlkLWNvbHVtbjpudGgtb2YtdHlwZSgybiArIDIpIHsgZ3JpZC1jb2x1bW46IDIgfSAud3AtYmxvY2stdG9vbHNldC1ibG9ja3MtZ3JpZC1jb2x1bW4udGItZ3JpZC1jb2x1bW5bZGF0YS10b29sc2V0LWJsb2Nrcy1ncmlkLWNvbHVtbj0iMzAzNGZiZTg4NmMxMTA1NGU5NWI0NmIwOWQzZTQxMTIiXSB7IGRpc3BsYXk6IGZsZXg7IH0gLnRiLWNvbnRhaW5lciAudGItY29udGFpbmVyLWlubmVye3dpZHRoOjEwMCU7bWFyZ2luOjAgYXV0b30gLnRiLWltYWdle3Bvc2l0aW9uOnJlbGF0aXZlO3RyYW5zaXRpb246dHJhbnNmb3JtIDAuMjVzIGVhc2V9LndwLWJsb2NrLWltYWdlIC50Yi1pbWFnZS5hbGlnbmNlbnRlcnttYXJnaW4tbGVmdDphdXRvO21hcmdpbi1yaWdodDphdXRvfS50Yi1pbWFnZSBpbWd7bWF4LXdpZHRoOjEwMCU7aGVpZ2h0OmF1dG87d2lkdGg6YXV0bzt0cmFuc2l0aW9uOnRyYW5zZm9ybSAwLjI1cyBlYXNlfS50Yi1pbWFnZSAudGItaW1hZ2UtY2FwdGlvbi1maXQtdG8taW1hZ2V7ZGlzcGxheTp0YWJsZX0udGItaW1hZ2UgLnRiLWltYWdlLWNhcHRpb24tZml0LXRvLWltYWdlIC50Yi1pbWFnZS1jYXB0aW9ue2Rpc3BsYXk6dGFibGUtY2FwdGlvbjtjYXB0aW9uLXNpZGU6Ym90dG9tfS50Yi1ncmlkLC50Yi1ncmlkPi5ibG9jay1lZGl0b3ItaW5uZXItYmxvY2tzPi5ibG9jay1lZGl0b3ItYmxvY2stbGlzdF9fbGF5b3V0e2Rpc3BsYXk6Z3JpZDtncmlkLXJvdy1nYXA6MjVweDtncmlkLWNvbHVtbi1nYXA6MjVweH0udGItZ3JpZC1pdGVte2JhY2tncm91bmQ6I2QzOGEwMztwYWRkaW5nOjMwcHh9LnRiLWdyaWQtY29sdW1ue2ZsZXgtd3JhcDp3cmFwfS50Yi1ncmlkLWNvbHVtbj4qe3dpZHRoOjEwMCV9LnRiLWdyaWQtY29sdW1uLnRiLWdyaWQtYWxpZ24tdG9we3dpZHRoOjEwMCU7ZGlzcGxheTpmbGV4O2FsaWduLWNvbnRlbnQ6ZmxleC1zdGFydH0udGItZ3JpZC1jb2x1bW4udGItZ3JpZC1hbGlnbi1jZW50ZXJ7d2lkdGg6MTAwJTtkaXNwbGF5OmZsZXg7YWxpZ24tY29udGVudDpjZW50ZXJ9LnRiLWdyaWQtY29sdW1uLnRiLWdyaWQtYWxpZ24tYm90dG9te3dpZHRoOjEwMCU7ZGlzcGxheTpmbGV4O2FsaWduLWNvbnRlbnQ6ZmxleC1lbmR9IC53cC1ibG9jay10b29sc2V0LWJsb2Nrcy1ncmlkLnRiLWdyaWRbZGF0YS10b29sc2V0LWJsb2Nrcy1ncmlkPSI0YjU1YWRmMWQzMzFmNDk2ZjhhM2I3OWJjNTkwMDczMCJdIHsgZ3JpZC10ZW1wbGF0ZS1jb2x1bW5zOiBtaW5tYXgoMCwgMC41ZnIpIG1pbm1heCgwLCAwLjVmcik7Z3JpZC1hdXRvLWZsb3c6IHJvdyB9IC53cC1ibG9jay10b29sc2V0LWJsb2Nrcy1ncmlkLnRiLWdyaWRbZGF0YS10b29sc2V0LWJsb2Nrcy1ncmlkPSI0YjU1YWRmMWQzMzFmNDk2ZjhhM2I3OWJjNTkwMDczMCJdID4gLnRiLWdyaWQtY29sdW1uOm50aC1vZi10eXBlKDJuICsgMSkgeyBncmlkLWNvbHVtbjogMSB9IC53cC1ibG9jay10b29sc2V0LWJsb2Nrcy1ncmlkLnRiLWdyaWRbZGF0YS10b29sc2V0LWJsb2Nrcy1ncmlkPSI0YjU1YWRmMWQzMzFmNDk2ZjhhM2I3OWJjNTkwMDczMCJdID4gLnRiLWdyaWQtY29sdW1uOm50aC1vZi10eXBlKDJuICsgMikgeyBncmlkLWNvbHVtbjogMiB9IC53cC1ibG9jay10b29sc2V0LWJsb2Nrcy1ncmlkLWNvbHVtbi50Yi1ncmlkLWNvbHVtbltkYXRhLXRvb2xzZXQtYmxvY2tzLWdyaWQtY29sdW1uPSI2ZTA4ZDFmNmQzY2M4MTc0M2JkZDA2Y2I4ZjhjYmUzYiJdIHsgZGlzcGxheTogZmxleDsgfSAudGItY29udGFpbmVyIC50Yi1jb250YWluZXItaW5uZXJ7d2lkdGg6MTAwJTttYXJnaW46MCBhdXRvfSAgLnRiLWltYWdle3Bvc2l0aW9uOnJlbGF0aXZlO3RyYW5zaXRpb246dHJhbnNmb3JtIDAuMjVzIGVhc2V9LndwLWJsb2NrLWltYWdlIC50Yi1pbWFnZS5hbGlnbmNlbnRlcnttYXJnaW4tbGVmdDphdXRvO21hcmdpbi1yaWdodDphdXRvfS50Yi1pbWFnZSBpbWd7bWF4LXdpZHRoOjEwMCU7aGVpZ2h0OmF1dG87d2lkdGg6YXV0bzt0cmFuc2l0aW9uOnRyYW5zZm9ybSAwLjI1cyBlYXNlfS50Yi1pbWFnZSAudGItaW1hZ2UtY2FwdGlvbi1maXQtdG8taW1hZ2V7ZGlzcGxheTp0YWJsZX0udGItaW1hZ2UgLnRiLWltYWdlLWNhcHRpb24tZml0LXRvLWltYWdlIC50Yi1pbWFnZS1jYXB0aW9ue2Rpc3BsYXk6dGFibGUtY2FwdGlvbjtjYXB0aW9uLXNpZGU6Ym90dG9tfS53cC1ibG9jay10b29sc2V0LWJsb2Nrcy1ncmlkLWNvbHVtbi50Yi1ncmlkLWNvbHVtbltkYXRhLXRvb2xzZXQtYmxvY2tzLWdyaWQtY29sdW1uPSIxNGViNTk4YzQ1NzM5MzZjNjFkNDQxNTlkNWVlYTQ0MiJdIHsgZGlzcGxheTogZmxleDsgfSAudGItY29udGFpbmVyIC50Yi1jb250YWluZXItaW5uZXJ7d2lkdGg6MTAwJTttYXJnaW46MCBhdXRvfSAudGItY29udGFpbmVyIC50Yi1jb250YWluZXItaW5uZXJ7d2lkdGg6MTAwJTttYXJnaW46MCBhdXRvfSB9IEBtZWRpYSBvbmx5IHNjcmVlbiBhbmQgKG1heC13aWR0aDogNTk5cHgpIHsgLnRiLWNvbnRhaW5lciAudGItY29udGFpbmVyLWlubmVye3dpZHRoOjEwMCU7bWFyZ2luOjAgYXV0b30udGItY29udGFpbmVyIC50Yi1jb250YWluZXItaW5uZXJ7d2lkdGg6MTAwJTttYXJnaW46MCBhdXRvfSAud3AtYmxvY2stdG9vbHNldC1ibG9ja3MtY29udGFpbmVyLnRiLWNvbnRhaW5lcltkYXRhLXRvb2xzZXQtYmxvY2tzLWNvbnRhaW5lcj0iOTQxZjcxZjZhZjUwOTQyM2YzOWQwYTUzZGU2ODQzMTYiXSB7IHBhZGRpbmctcmlnaHQ6IDE1cHg7cGFkZGluZy1sZWZ0OiAxNXB4OyB9IC50Yi1jb250YWluZXIgLnRiLWNvbnRhaW5lci1pbm5lcnt3aWR0aDoxMDAlO21hcmdpbjowIGF1dG99LnRiLWdyaWQsLnRiLWdyaWQ+LmJsb2NrLWVkaXRvci1pbm5lci1ibG9ja3M+LmJsb2NrLWVkaXRvci1ibG9jay1saXN0X19sYXlvdXR7ZGlzcGxheTpncmlkO2dyaWQtcm93LWdhcDoyNXB4O2dyaWQtY29sdW1uLWdhcDoyNXB4fS50Yi1ncmlkLWl0ZW17YmFja2dyb3VuZDojZDM4YTAzO3BhZGRpbmc6MzBweH0udGItZ3JpZC1jb2x1bW57ZmxleC13cmFwOndyYXB9LnRiLWdyaWQtY29sdW1uPip7d2lkdGg6MTAwJX0udGItZ3JpZC1jb2x1bW4udGItZ3JpZC1hbGlnbi10b3B7d2lkdGg6MTAwJTtkaXNwbGF5OmZsZXg7YWxpZ24tY29udGVudDpmbGV4LXN0YXJ0fS50Yi1ncmlkLWNvbHVtbi50Yi1ncmlkLWFsaWduLWNlbnRlcnt3aWR0aDoxMDAlO2Rpc3BsYXk6ZmxleDthbGlnbi1jb250ZW50OmNlbnRlcn0udGItZ3JpZC1jb2x1bW4udGItZ3JpZC1hbGlnbi1ib3R0b217d2lkdGg6MTAwJTtkaXNwbGF5OmZsZXg7YWxpZ24tY29udGVudDpmbGV4LWVuZH0gLndwLWJsb2NrLXRvb2xzZXQtYmxvY2tzLWdyaWQudGItZ3JpZFtkYXRhLXRvb2xzZXQtYmxvY2tzLWdyaWQ9IjE0ZWM4YWNmYmM2NGFmODg4Njc4OTBkNzhhZjU2OGM5Il0geyBncmlkLXRlbXBsYXRlLWNvbHVtbnM6IG1pbm1heCgwLCAxZnIpO2dyaWQtYXV0by1mbG93OiByb3cgfSAud3AtYmxvY2stdG9vbHNldC1ibG9ja3MtZ3JpZC50Yi1ncmlkW2RhdGEtdG9vbHNldC1ibG9ja3MtZ3JpZD0iMTRlYzhhY2ZiYzY0YWY4ODg2Nzg5MGQ3OGFmNTY4YzkiXSAgPiAudGItZ3JpZC1jb2x1bW46bnRoLW9mLXR5cGUoMW4rMSkgeyBncmlkLWNvbHVtbjogMSB9IC53cC1ibG9jay10b29sc2V0LWJsb2Nrcy1ncmlkLWNvbHVtbi50Yi1ncmlkLWNvbHVtbltkYXRhLXRvb2xzZXQtYmxvY2tzLWdyaWQtY29sdW1uPSIzMDM0ZmJlODg2YzExMDU0ZTk1YjQ2YjA5ZDNlNDExMiJdIHsgZGlzcGxheTogZmxleDsgfSAudGItY29udGFpbmVyIC50Yi1jb250YWluZXItaW5uZXJ7d2lkdGg6MTAwJTttYXJnaW46MCBhdXRvfSAudGItaW1hZ2V7cG9zaXRpb246cmVsYXRpdmU7dHJhbnNpdGlvbjp0cmFuc2Zvcm0gMC4yNXMgZWFzZX0ud3AtYmxvY2staW1hZ2UgLnRiLWltYWdlLmFsaWduY2VudGVye21hcmdpbi1sZWZ0OmF1dG87bWFyZ2luLXJpZ2h0OmF1dG99LnRiLWltYWdlIGltZ3ttYXgtd2lkdGg6MTAwJTtoZWlnaHQ6YXV0bzt3aWR0aDphdXRvO3RyYW5zaXRpb246dHJhbnNmb3JtIDAuMjVzIGVhc2V9LnRiLWltYWdlIC50Yi1pbWFnZS1jYXB0aW9uLWZpdC10by1pbWFnZXtkaXNwbGF5OnRhYmxlfS50Yi1pbWFnZSAudGItaW1hZ2UtY2FwdGlvbi1maXQtdG8taW1hZ2UgLnRiLWltYWdlLWNhcHRpb257ZGlzcGxheTp0YWJsZS1jYXB0aW9uO2NhcHRpb24tc2lkZTpib3R0b219LnRiLWdyaWQsLnRiLWdyaWQ+LmJsb2NrLWVkaXRvci1pbm5lci1ibG9ja3M+LmJsb2NrLWVkaXRvci1ibG9jay1saXN0X19sYXlvdXR7ZGlzcGxheTpncmlkO2dyaWQtcm93LWdhcDoyNXB4O2dyaWQtY29sdW1uLWdhcDoyNXB4fS50Yi1ncmlkLWl0ZW17YmFja2dyb3VuZDojZDM4YTAzO3BhZGRpbmc6MzBweH0udGItZ3JpZC1jb2x1bW57ZmxleC13cmFwOndyYXB9LnRiLWdyaWQtY29sdW1uPip7d2lkdGg6MTAwJX0udGItZ3JpZC1jb2x1bW4udGItZ3JpZC1hbGlnbi10b3B7d2lkdGg6MTAwJTtkaXNwbGF5OmZsZXg7YWxpZ24tY29udGVudDpmbGV4LXN0YXJ0fS50Yi1ncmlkLWNvbHVtbi50Yi1ncmlkLWFsaWduLWNlbnRlcnt3aWR0aDoxMDAlO2Rpc3BsYXk6ZmxleDthbGlnbi1jb250ZW50OmNlbnRlcn0udGItZ3JpZC1jb2x1bW4udGItZ3JpZC1hbGlnbi1ib3R0b217d2lkdGg6MTAwJTtkaXNwbGF5OmZsZXg7YWxpZ24tY29udGVudDpmbGV4LWVuZH0gLndwLWJsb2NrLXRvb2xzZXQtYmxvY2tzLWdyaWQudGItZ3JpZFtkYXRhLXRvb2xzZXQtYmxvY2tzLWdyaWQ9IjRiNTVhZGYxZDMzMWY0OTZmOGEzYjc5YmM1OTAwNzMwIl0geyBncmlkLXRlbXBsYXRlLWNvbHVtbnM6IG1pbm1heCgwLCAxZnIpO2dyaWQtYXV0by1mbG93OiByb3cgfSAud3AtYmxvY2stdG9vbHNldC1ibG9ja3MtZ3JpZC50Yi1ncmlkW2RhdGEtdG9vbHNldC1ibG9ja3MtZ3JpZD0iNGI1NWFkZjFkMzMxZjQ5NmY4YTNiNzliYzU5MDA3MzAiXSAgPiAudGItZ3JpZC1jb2x1bW46bnRoLW9mLXR5cGUoMW4rMSkgeyBncmlkLWNvbHVtbjogMSB9IC53cC1ibG9jay10b29sc2V0LWJsb2Nrcy1ncmlkLWNvbHVtbi50Yi1ncmlkLWNvbHVtbltkYXRhLXRvb2xzZXQtYmxvY2tzLWdyaWQtY29sdW1uPSI2ZTA4ZDFmNmQzY2M4MTc0M2JkZDA2Y2I4ZjhjYmUzYiJdIHsgZGlzcGxheTogZmxleDsgfSAudGItY29udGFpbmVyIC50Yi1jb250YWluZXItaW5uZXJ7d2lkdGg6MTAwJTttYXJnaW46MCBhdXRvfSAgLnRiLWltYWdle3Bvc2l0aW9uOnJlbGF0aXZlO3RyYW5zaXRpb246dHJhbnNmb3JtIDAuMjVzIGVhc2V9LndwLWJsb2NrLWltYWdlIC50Yi1pbWFnZS5hbGlnbmNlbnRlcnttYXJnaW4tbGVmdDphdXRvO21hcmdpbi1yaWdodDphdXRvfS50Yi1pbWFnZSBpbWd7bWF4LXdpZHRoOjEwMCU7aGVpZ2h0OmF1dG87d2lkdGg6YXV0bzt0cmFuc2l0aW9uOnRyYW5zZm9ybSAwLjI1cyBlYXNlfS50Yi1pbWFnZSAudGItaW1hZ2UtY2FwdGlvbi1maXQtdG8taW1hZ2V7ZGlzcGxheTp0YWJsZX0udGItaW1hZ2UgLnRiLWltYWdlLWNhcHRpb24tZml0LXRvLWltYWdlIC50Yi1pbWFnZS1jYXB0aW9ue2Rpc3BsYXk6dGFibGUtY2FwdGlvbjtjYXB0aW9uLXNpZGU6Ym90dG9tfS53cC1ibG9jay10b29sc2V0LWJsb2Nrcy1ncmlkLWNvbHVtbi50Yi1ncmlkLWNvbHVtbltkYXRhLXRvb2xzZXQtYmxvY2tzLWdyaWQtY29sdW1uPSIxNGViNTk4YzQ1NzM5MzZjNjFkNDQxNTlkNWVlYTQ0MiJdIHsgZGlzcGxheTogZmxleDsgfSAudGItZmllbGRzLWFuZC10ZXh0W2RhdGEtdG9vbHNldC1ibG9ja3MtZmllbGRzLWFuZC10ZXh0PSIwNWM3MTJhNWEyMmI1OWRmMWJlNGQyODQ4NzA1ZDMzNSJdIHsgZm9udC1zaXplOiAyNHB4O2xpbmUtaGVpZ2h0OiAzMnB4OyB9IC50Yi1maWVsZHMtYW5kLXRleHRbZGF0YS10b29sc2V0LWJsb2Nrcy1maWVsZHMtYW5kLXRleHQ9IjA1YzcxMmE1YTIyYjU5ZGYxYmU0ZDI4NDg3MDVkMzM1Il0gcCB7IGZvbnQtc2l6ZTogMjRweDtsaW5lLWhlaWdodDogMzJweDsgfSAudGItY29udGFpbmVyIC50Yi1jb250YWluZXItaW5uZXJ7d2lkdGg6MTAwJTttYXJnaW46MCBhdXRvfWgxLnRiLWhlYWRpbmdbZGF0YS10b29sc2V0LWJsb2Nrcy1oZWFkaW5nPSI3ODJkMWZhOGI4NjdjZWUzZTI2OTc4MTdlMTg3MmFkYSJdICB7IGZvbnQtc2l6ZTogNDhweDtsaW5lLWhlaWdodDogNDBweDsgfSAgLnRiLWNvbnRhaW5lciAudGItY29udGFpbmVyLWlubmVye3dpZHRoOjEwMCU7bWFyZ2luOjAgYXV0b30gfSA=
If global weather seem inside out and upside down to you, that’s because it is!
LnRiLWNvbnRhaW5lciAudGItY29udGFpbmVyLWlubmVye3dpZHRoOjEwMCU7bWFyZ2luOjAgYXV0b30gLndwLWJsb2NrLXRvb2xzZXQtYmxvY2tzLWNvbnRhaW5lci50Yi1jb250YWluZXJbZGF0YS10b29sc2V0LWJsb2Nrcy1jb250YWluZXI9IjUwZWUyMTY1MTllYzRkYWJkNWZkNmIwMGQ2N2Y4MWRmIl0geyBwYWRkaW5nOiAyNXB4IDI1cHggMHB4IDI1cHg7IH0gLndwLWJsb2NrLXRvb2xzZXQtYmxvY2tzLWNvbnRhaW5lci50Yi1jb250YWluZXJbZGF0YS10b29sc2V0LWJsb2Nrcy1jb250YWluZXI9IjUwZWUyMTY1MTllYzRkYWJkNWZkNmIwMGQ2N2Y4MWRmIl0gPiAudGItY29udGFpbmVyLWlubmVyIHsgbWF4LXdpZHRoOiAxMjAwcHg7IH0gLnRiLWNvbnRhaW5lciAudGItY29udGFpbmVyLWlubmVye3dpZHRoOjEwMCU7bWFyZ2luOjAgYXV0b30gLndwLWJsb2NrLXRvb2xzZXQtYmxvY2tzLWNvbnRhaW5lci50Yi1jb250YWluZXJbZGF0YS10b29sc2V0LWJsb2Nrcy1jb250YWluZXI9Ijk0MWY3MWY2YWY1MDk0MjNmMzlkMGE1M2RlNjg0MzE2Il0geyBiYWNrZ3JvdW5kOiByZ2JhKCAyNTUsIDI1NSwgMjU1LCAxICk7cGFkZGluZzogNDVweDttYXJnaW4tdG9wOiAtMTAwcHg7Ym94LXNoYWRvdzogMXB4IC0xcHggMTBweCAwIHJnYmEoIDAsIDAsIDAsIDAuNSApO21pbi1oZWlnaHQ6IDYwMHB4OyB9IC50Yi1jb250YWluZXIgLnRiLWNvbnRhaW5lci1pbm5lcnt3aWR0aDoxMDAlO21hcmdpbjowIGF1dG99IC53cC1ibG9jay10b29sc2V0LWJsb2Nrcy1jb250YWluZXIudGItY29udGFpbmVyW2RhdGEtdG9vbHNldC1ibG9ja3MtY29udGFpbmVyPSIzZmNkODI0ZGMxNzQ0ZjY3NGJhYTExOWUzMGI2ZWUyNSJdIHsgYmFja2dyb3VuZDogcmdiYSggOTMsIDE3MywgMTk2LCAxICk7cGFkZGluZzogMjVweDsgfSAudGItZ3JpZCwudGItZ3JpZD4uYmxvY2stZWRpdG9yLWlubmVyLWJsb2Nrcz4uYmxvY2stZWRpdG9yLWJsb2NrLWxpc3RfX2xheW91dHtkaXNwbGF5OmdyaWQ7Z3JpZC1yb3ctZ2FwOjI1cHg7Z3JpZC1jb2x1bW4tZ2FwOjI1cHh9LnRiLWdyaWQtaXRlbXtiYWNrZ3JvdW5kOiNkMzhhMDM7cGFkZGluZzozMHB4fS50Yi1ncmlkLWNvbHVtbntmbGV4LXdyYXA6d3JhcH0udGItZ3JpZC1jb2x1bW4+Knt3aWR0aDoxMDAlfS50Yi1ncmlkLWNvbHVtbi50Yi1ncmlkLWFsaWduLXRvcHt3aWR0aDoxMDAlO2Rpc3BsYXk6ZmxleDthbGlnbi1jb250ZW50OmZsZXgtc3RhcnR9LnRiLWdyaWQtY29sdW1uLnRiLWdyaWQtYWxpZ24tY2VudGVye3dpZHRoOjEwMCU7ZGlzcGxheTpmbGV4O2FsaWduLWNvbnRlbnQ6Y2VudGVyfS50Yi1ncmlkLWNvbHVtbi50Yi1ncmlkLWFsaWduLWJvdHRvbXt3aWR0aDoxMDAlO2Rpc3BsYXk6ZmxleDthbGlnbi1jb250ZW50OmZsZXgtZW5kfSAud3AtYmxvY2stdG9vbHNldC1ibG9ja3MtZ3JpZC50Yi1ncmlkW2RhdGEtdG9vbHNldC1ibG9ja3MtZ3JpZD0iMTRlYzhhY2ZiYzY0YWY4ODg2Nzg5MGQ3OGFmNTY4YzkiXSB7IGdyaWQtdGVtcGxhdGUtY29sdW1uczogbWlubWF4KDAsIDAuMzM1ZnIpIG1pbm1heCgwLCAwLjY2NWZyKTtncmlkLWF1dG8tZmxvdzogcm93IH0gLndwLWJsb2NrLXRvb2xzZXQtYmxvY2tzLWdyaWQudGItZ3JpZFtkYXRhLXRvb2xzZXQtYmxvY2tzLWdyaWQ9IjE0ZWM4YWNmYmM2NGFmODg4Njc4OTBkNzhhZjU2OGM5Il0gPiAudGItZ3JpZC1jb2x1bW46bnRoLW9mLXR5cGUoMm4gKyAxKSB7IGdyaWQtY29sdW1uOiAxIH0gLndwLWJsb2NrLXRvb2xzZXQtYmxvY2tzLWdyaWQudGItZ3JpZFtkYXRhLXRvb2xzZXQtYmxvY2tzLWdyaWQ9IjE0ZWM4YWNmYmM2NGFmODg4Njc4OTBkNzhhZjU2OGM5Il0gPiAudGItZ3JpZC1jb2x1bW46bnRoLW9mLXR5cGUoMm4gKyAyKSB7IGdyaWQtY29sdW1uOiAyIH0gLnRiLWZpZWxkcy1hbmQtdGV4dFtkYXRhLXRvb2xzZXQtYmxvY2tzLWZpZWxkcy1hbmQtdGV4dD0iNDY3MDMzZjZmOWI1YTMwZDdhMGJlYzdjYjJiMzgyYTUiXSB7IGZvbnQtc2l6ZTogMTZweDtsaW5lLWhlaWdodDogNDBweDtjb2xvcjogcmdiYSggMjU1LCAyNTUsIDI1NSwgMSApO21hcmdpbi10b3A6IDQwcHg7IH0gLnRiLWZpZWxkcy1hbmQtdGV4dFtkYXRhLXRvb2xzZXQtYmxvY2tzLWZpZWxkcy1hbmQtdGV4dD0iNDY3MDMzZjZmOWI1YTMwZDdhMGJlYzdjYjJiMzgyYTUiXSBwIHsgZm9udC1zaXplOiAxNnB4O2xpbmUtaGVpZ2h0OiA0MHB4O2NvbG9yOiByZ2JhKCAyNTUsIDI1NSwgMjU1LCAxICk7IH0gLndwLWJsb2NrLXRvb2xzZXQtYmxvY2tzLWdyaWQtY29sdW1uLnRiLWdyaWQtY29sdW1uW2RhdGEtdG9vbHNldC1ibG9ja3MtZ3JpZC1jb2x1bW49IjMwMzRmYmU4ODZjMTEwNTRlOTViNDZiMDlkM2U0MTEyIl0geyBkaXNwbGF5OiBmbGV4OyB9IC50Yi1jb250YWluZXIgLnRiLWNvbnRhaW5lci1pbm5lcnt3aWR0aDoxMDAlO21hcmdpbjowIGF1dG99IC53cC1ibG9jay10b29sc2V0LWJsb2Nrcy1jb250YWluZXIudGItY29udGFpbmVyW2RhdGEtdG9vbHNldC1ibG9ja3MtY29udGFpbmVyPSJlZDM4MzJhYTYyMDFjYmVjNWIxZTViOTAyZGMwNjdlMiJdIHsgcGFkZGluZzogMjVweDsgfSAudGItaGVhZGluZ1tkYXRhLXRvb2xzZXQtYmxvY2tzLWhlYWRpbmc9ImU3NmFkMWRiZWY2ZTEzNmJjZDcyMGIxYTM1ZjFlZGIzIl0gIHsgZm9udC1zaXplOiAyMHB4O2NvbG9yOiByZ2JhKCAyNTUsIDI1NSwgMjU1LCAxICk7bWFyZ2luLXRvcDogMTVweDsgfSAgLnRiLWltYWdle3Bvc2l0aW9uOnJlbGF0aXZlO3RyYW5zaXRpb246dHJhbnNmb3JtIDAuMjVzIGVhc2V9LndwLWJsb2NrLWltYWdlIC50Yi1pbWFnZS5hbGlnbmNlbnRlcnttYXJnaW4tbGVmdDphdXRvO21hcmdpbi1yaWdodDphdXRvfS50Yi1pbWFnZSBpbWd7bWF4LXdpZHRoOjEwMCU7aGVpZ2h0OmF1dG87d2lkdGg6YXV0bzt0cmFuc2l0aW9uOnRyYW5zZm9ybSAwLjI1cyBlYXNlfS50Yi1pbWFnZSAudGItaW1hZ2UtY2FwdGlvbi1maXQtdG8taW1hZ2V7ZGlzcGxheTp0YWJsZX0udGItaW1hZ2UgLnRiLWltYWdlLWNhcHRpb24tZml0LXRvLWltYWdlIC50Yi1pbWFnZS1jYXB0aW9ue2Rpc3BsYXk6dGFibGUtY2FwdGlvbjtjYXB0aW9uLXNpZGU6Ym90dG9tfSAud3AtYmxvY2staW1hZ2UudGItaW1hZ2VbZGF0YS10b29sc2V0LWJsb2Nrcy1pbWFnZT0iNzRkZWZlMmM0NDRlMWEwMWQ1MjY2YjJiMjZjZmVkZDMiXSB7IG1heC13aWR0aDogMTAwJTsgfSAudGItZ3JpZCwudGItZ3JpZD4uYmxvY2stZWRpdG9yLWlubmVyLWJsb2Nrcz4uYmxvY2stZWRpdG9yLWJsb2NrLWxpc3RfX2xheW91dHtkaXNwbGF5OmdyaWQ7Z3JpZC1yb3ctZ2FwOjI1cHg7Z3JpZC1jb2x1bW4tZ2FwOjI1cHh9LnRiLWdyaWQtaXRlbXtiYWNrZ3JvdW5kOiNkMzhhMDM7cGFkZGluZzozMHB4fS50Yi1ncmlkLWNvbHVtbntmbGV4LXdyYXA6d3JhcH0udGItZ3JpZC1jb2x1bW4+Knt3aWR0aDoxMDAlfS50Yi1ncmlkLWNvbHVtbi50Yi1ncmlkLWFsaWduLXRvcHt3aWR0aDoxMDAlO2Rpc3BsYXk6ZmxleDthbGlnbi1jb250ZW50OmZsZXgtc3RhcnR9LnRiLWdyaWQtY29sdW1uLnRiLWdyaWQtYWxpZ24tY2VudGVye3dpZHRoOjEwMCU7ZGlzcGxheTpmbGV4O2FsaWduLWNvbnRlbnQ6Y2VudGVyfS50Yi1ncmlkLWNvbHVtbi50Yi1ncmlkLWFsaWduLWJvdHRvbXt3aWR0aDoxMDAlO2Rpc3BsYXk6ZmxleDthbGlnbi1jb250ZW50OmZsZXgtZW5kfSAud3AtYmxvY2stdG9vbHNldC1ibG9ja3MtZ3JpZC50Yi1ncmlkW2RhdGEtdG9vbHNldC1ibG9ja3MtZ3JpZD0iNGI1NWFkZjFkMzMxZjQ5NmY4YTNiNzliYzU5MDA3MzAiXSB7IGdyaWQtdGVtcGxhdGUtY29sdW1uczogbWlubWF4KDAsIDAuODA1ZnIpIG1pbm1heCgwLCAwLjE5NWZyKTtncmlkLWF1dG8tZmxvdzogcm93IH0gLndwLWJsb2NrLXRvb2xzZXQtYmxvY2tzLWdyaWQudGItZ3JpZFtkYXRhLXRvb2xzZXQtYmxvY2tzLWdyaWQ9IjRiNTVhZGYxZDMzMWY0OTZmOGEzYjc5YmM1OTAwNzMwIl0gPiAudGItZ3JpZC1jb2x1bW46bnRoLW9mLXR5cGUoMm4gKyAxKSB7IGdyaWQtY29sdW1uOiAxIH0gLndwLWJsb2NrLXRvb2xzZXQtYmxvY2tzLWdyaWQudGItZ3JpZFtkYXRhLXRvb2xzZXQtYmxvY2tzLWdyaWQ9IjRiNTVhZGYxZDMzMWY0OTZmOGEzYjc5YmM1OTAwNzMwIl0gPiAudGItZ3JpZC1jb2x1bW46bnRoLW9mLXR5cGUoMm4gKyAyKSB7IGdyaWQtY29sdW1uOiAyIH0gLndwLWJsb2NrLXRvb2xzZXQtYmxvY2tzLWdyaWQtY29sdW1uLnRiLWdyaWQtY29sdW1uW2RhdGEtdG9vbHNldC1ibG9ja3MtZ3JpZC1jb2x1bW49IjZlMDhkMWY2ZDNjYzgxNzQzYmRkMDZjYjhmOGNiZTNiIl0geyBwYWRkaW5nLXRvcDogMjVweDtkaXNwbGF5OiBmbGV4OyB9IC50Yi1jb250YWluZXIgLnRiLWNvbnRhaW5lci1pbm5lcnt3aWR0aDoxMDAlO21hcmdpbjowIGF1dG99IC53cC1ibG9jay10b29sc2V0LWJsb2Nrcy1jb250YWluZXIudGItY29udGFpbmVyW2RhdGEtdG9vbHNldC1ibG9ja3MtY29udGFpbmVyPSI3NmI5ZTE5YWViZDc4YjQ2N2IwNGM2NGFjZmUzMzE2NyJdIHsgcGFkZGluZzogMHB4OyB9IGgyLnRiLWhlYWRpbmdbZGF0YS10b29sc2V0LWJsb2Nrcy1oZWFkaW5nPSI0YzllYTlkNDYyZGI0MWZhOThhYzNjN2U1MTNhYjhmNiJdICB7IGZvbnQtc2l6ZTogMTZweDt0ZXh0LWRlY29yYXRpb246IG5vbmU7IH0gIGgyLnRiLWhlYWRpbmdbZGF0YS10b29sc2V0LWJsb2Nrcy1oZWFkaW5nPSJjOWZhZDk4NmFmMGQ0M2IwNTFhN2EzZGNlYWQyNjk0MSJdICB7IGZvbnQtc2l6ZTogMThweDtjb2xvcjogcmdiYSggMzQsIDg0LCAxMTgsIDEgKTt0ZXh0LWFsaWduOiBjZW50ZXI7bWFyZ2luLXRvcDogMTBweDsgfSAgLnRiLWltYWdle3Bvc2l0aW9uOnJlbGF0aXZlO3RyYW5zaXRpb246dHJhbnNmb3JtIDAuMjVzIGVhc2V9LndwLWJsb2NrLWltYWdlIC50Yi1pbWFnZS5hbGlnbmNlbnRlcnttYXJnaW4tbGVmdDphdXRvO21hcmdpbi1yaWdodDphdXRvfS50Yi1pbWFnZSBpbWd7bWF4LXdpZHRoOjEwMCU7aGVpZ2h0OmF1dG87d2lkdGg6YXV0bzt0cmFuc2l0aW9uOnRyYW5zZm9ybSAwLjI1cyBlYXNlfS50Yi1pbWFnZSAudGItaW1hZ2UtY2FwdGlvbi1maXQtdG8taW1hZ2V7ZGlzcGxheTp0YWJsZX0udGItaW1hZ2UgLnRiLWltYWdlLWNhcHRpb24tZml0LXRvLWltYWdlIC50Yi1pbWFnZS1jYXB0aW9ue2Rpc3BsYXk6dGFibGUtY2FwdGlvbjtjYXB0aW9uLXNpZGU6Ym90dG9tfSAud3AtYmxvY2staW1hZ2UudGItaW1hZ2VbZGF0YS10b29sc2V0LWJsb2Nrcy1pbWFnZT0iM2RhYWViMzdjMGZmYjA3MDVjNGViMWVkNTBlOGQ5MzUiXSB7IG1heC13aWR0aDogMTAwJTsgfSAud3AtYmxvY2stdG9vbHNldC1ibG9ja3MtZ3JpZC1jb2x1bW4udGItZ3JpZC1jb2x1bW5bZGF0YS10b29sc2V0LWJsb2Nrcy1ncmlkLWNvbHVtbj0iMTRlYjU5OGM0NTczOTM2YzYxZDQ0MTU5ZDVlZWE0NDIiXSB7IGRpc3BsYXk6IGZsZXg7IH0gLnRiLWZpZWxkcy1hbmQtdGV4dFtkYXRhLXRvb2xzZXQtYmxvY2tzLWZpZWxkcy1hbmQtdGV4dD0iMDVjNzEyYTVhMjJiNTlkZjFiZTRkMjg0ODcwNWQzMzUiXSB7IGZvbnQtc2l6ZTogMjRweDtsaW5lLWhlaWdodDogNDBweDtjb2xvcjogcmdiYSggMzQsIDg0LCAxMTgsIDEgKTsgfSAudGItZmllbGRzLWFuZC10ZXh0W2RhdGEtdG9vbHNldC1ibG9ja3MtZmllbGRzLWFuZC10ZXh0PSIwNWM3MTJhNWEyMmI1OWRmMWJlNGQyODQ4NzA1ZDMzNSJdIHAgeyBmb250LXNpemU6IDI0cHg7bGluZS1oZWlnaHQ6IDQwcHg7Y29sb3I6IHJnYmEoIDM0LCA4NCwgMTE4LCAxICk7IH0gLnRiLWNvbnRhaW5lciAudGItY29udGFpbmVyLWlubmVye3dpZHRoOjEwMCU7bWFyZ2luOjAgYXV0b30gLndwLWJsb2NrLXRvb2xzZXQtYmxvY2tzLWNvbnRhaW5lci50Yi1jb250YWluZXJbZGF0YS10b29sc2V0LWJsb2Nrcy1jb250YWluZXI9ImEyMWI5OTg4MDg3MjNjOGFiMzU4MWNkMzIwM2ZiYmUzIl0geyBiYWNrZ3JvdW5kOmxpbmVhci1ncmFkaWVudChyZ2JhKCAwLCAwLCAwLCAwLjMyICkscmdiYSggMCwgMCwgMCwgMC4zMiApKSwgIHJnYmEoIDI1NSwgMjU1LCAyNTUsIDAgKSB1cmwoJycpIGNlbnRlciBjZW50ZXIgbm8tcmVwZWF0O2JhY2tncm91bmQtc2l6ZTphdXRvLCBjb3ZlcjtwYWRkaW5nOiAyNXB4O21hcmdpbi10b3A6IC01MDBweDttaW4taGVpZ2h0OiA1MDBweDtkaXNwbGF5Om1zLWZsZXhib3ggIWltcG9ydGFudDtkaXNwbGF5OmZsZXggIWltcG9ydGFudDstbXMtZmxleC1kaXJlY3Rpb246Y29sdW1uO2ZsZXgtZGlyZWN0aW9uOmNvbHVtbjstbXMtZmxleC1wYWNrOmNlbnRlcjtqdXN0aWZ5LWNvbnRlbnQ6Y2VudGVyOyB9IC53cC1ibG9jay10b29sc2V0LWJsb2Nrcy1jb250YWluZXIudGItY29udGFpbmVyW2RhdGEtdG9vbHNldC1ibG9ja3MtY29udGFpbmVyPSJhMjFiOTk4ODA4NzIzYzhhYjM1ODFjZDMyMDNmYmJlMyJdID4gLnRiLWNvbnRhaW5lci1pbm5lciB7IG1heC13aWR0aDogMTIwMHB4OyB9IC53cC1ibG9jay10b29sc2V0LWJsb2Nrcy1jb250YWluZXIudGItY29udGFpbmVyW2RhdGEtdG9vbHNldC1ibG9ja3MtY29udGFpbmVyPSJhMjFiOTk4ODA4NzIzYzhhYjM1ODFjZDMyMDNmYmJlMyJdIHAgeyBsZXR0ZXItc3BhY2luZzogMHB4OyB9IC50Yi1maWVsZHMtYW5kLXRleHRbZGF0YS10b29sc2V0LWJsb2Nrcy1maWVsZHMtYW5kLXRleHQ9ImVkMzgwMWMyMjk1ZDQ1N2E0MTg3NzdjMzgyNGRmMWIzIl0geyBmb250LXNpemU6IDIwcHg7Y29sb3I6IHJnYmEoIDI1NSwgMjU1LCAyNTUsIDEgKTsgfSAudGItZmllbGRzLWFuZC10ZXh0W2RhdGEtdG9vbHNldC1ibG9ja3MtZmllbGRzLWFuZC10ZXh0PSJlZDM4MDFjMjI5NWQ0NTdhNDE4Nzc3YzM4MjRkZjFiMyJdIHAgeyBmb250LXNpemU6IDIwcHg7Y29sb3I6IHJnYmEoIDI1NSwgMjU1LCAyNTUsIDEgKTsgfSBoMS50Yi1oZWFkaW5nW2RhdGEtdG9vbHNldC1ibG9ja3MtaGVhZGluZz0iNzgyZDFmYThiODY3Y2VlM2UyNjk3ODE3ZTE4NzJhZGEiXSAgeyBmb250LXNpemU6IDY0cHg7bGluZS1oZWlnaHQ6IDUycHg7bGV0dGVyLXNwYWNpbmc6IDBweDt0ZXh0LXRyYW5zZm9ybTogdXBwZXJjYXNlO2NvbG9yOiByZ2JhKCAyNTUsIDI1NSwgMjU1LCAxICk7dGV4dC1hbGlnbjogY2VudGVyO3BhZGRpbmctdG9wOiAwcHg7cGFkZGluZy1ib3R0b206IDBweDttYXJnaW4tdG9wOiA3NXB4O21hcmdpbi1ib3R0b206IDBweDsgfSAgLnRiLWNvbnRhaW5lciAudGItY29udGFpbmVyLWlubmVye3dpZHRoOjEwMCU7bWFyZ2luOjAgYXV0b30gLndwLWJsb2NrLXRvb2xzZXQtYmxvY2tzLWNvbnRhaW5lci50Yi1jb250YWluZXJbZGF0YS10b29sc2V0LWJsb2Nrcy1jb250YWluZXI9IjM2NjdlNzYzMWM0MjhjNzA0YjI5NjdiZGJhNzAxYTJiIl0geyBiYWNrZ3JvdW5kOmxpbmVhci1ncmFkaWVudChyZ2JhKCAyNTUsIDI1NSwgMjU1LCAwICkscmdiYSggMjU1LCAyNTUsIDI1NSwgMCApKSwgIHJnYmEoIDAsIDAsIDAsIDEgKSB1cmwoJycpIGNlbnRlciB0b3Agbm8tcmVwZWF0O2JhY2tncm91bmQtc2l6ZTphdXRvLCBjb3ZlcjtwYWRkaW5nOiAwcHg7bWFyZ2luOiAwcHg7bWluLWhlaWdodDogNTAwcHg7IH0gQG1lZGlhIG9ubHkgc2NyZWVuIGFuZCAobWF4LXdpZHRoOiA3ODFweCkgeyAudGItY29udGFpbmVyIC50Yi1jb250YWluZXItaW5uZXJ7d2lkdGg6MTAwJTttYXJnaW46MCBhdXRvfS50Yi1jb250YWluZXIgLnRiLWNvbnRhaW5lci1pbm5lcnt3aWR0aDoxMDAlO21hcmdpbjowIGF1dG99LnRiLWNvbnRhaW5lciAudGItY29udGFpbmVyLWlubmVye3dpZHRoOjEwMCU7bWFyZ2luOjAgYXV0b30udGItZ3JpZCwudGItZ3JpZD4uYmxvY2stZWRpdG9yLWlubmVyLWJsb2Nrcz4uYmxvY2stZWRpdG9yLWJsb2NrLWxpc3RfX2xheW91dHtkaXNwbGF5OmdyaWQ7Z3JpZC1yb3ctZ2FwOjI1cHg7Z3JpZC1jb2x1bW4tZ2FwOjI1cHh9LnRiLWdyaWQtaXRlbXtiYWNrZ3JvdW5kOiNkMzhhMDM7cGFkZGluZzozMHB4fS50Yi1ncmlkLWNvbHVtbntmbGV4LXdyYXA6d3JhcH0udGItZ3JpZC1jb2x1bW4+Knt3aWR0aDoxMDAlfS50Yi1ncmlkLWNvbHVtbi50Yi1ncmlkLWFsaWduLXRvcHt3aWR0aDoxMDAlO2Rpc3BsYXk6ZmxleDthbGlnbi1jb250ZW50OmZsZXgtc3RhcnR9LnRiLWdyaWQtY29sdW1uLnRiLWdyaWQtYWxpZ24tY2VudGVye3dpZHRoOjEwMCU7ZGlzcGxheTpmbGV4O2FsaWduLWNvbnRlbnQ6Y2VudGVyfS50Yi1ncmlkLWNvbHVtbi50Yi1ncmlkLWFsaWduLWJvdHRvbXt3aWR0aDoxMDAlO2Rpc3BsYXk6ZmxleDthbGlnbi1jb250ZW50OmZsZXgtZW5kfSAud3AtYmxvY2stdG9vbHNldC1ibG9ja3MtZ3JpZC50Yi1ncmlkW2RhdGEtdG9vbHNldC1ibG9ja3MtZ3JpZD0iMTRlYzhhY2ZiYzY0YWY4ODg2Nzg5MGQ3OGFmNTY4YzkiXSB7IGdyaWQtdGVtcGxhdGUtY29sdW1uczogbWlubWF4KDAsIDAuNWZyKSBtaW5tYXgoMCwgMC41ZnIpO2dyaWQtYXV0by1mbG93OiByb3cgfSAud3AtYmxvY2stdG9vbHNldC1ibG9ja3MtZ3JpZC50Yi1ncmlkW2RhdGEtdG9vbHNldC1ibG9ja3MtZ3JpZD0iMTRlYzhhY2ZiYzY0YWY4ODg2Nzg5MGQ3OGFmNTY4YzkiXSA+IC50Yi1ncmlkLWNvbHVtbjpudGgtb2YtdHlwZSgybiArIDEpIHsgZ3JpZC1jb2x1bW46IDEgfSAud3AtYmxvY2stdG9vbHNldC1ibG9ja3MtZ3JpZC50Yi1ncmlkW2RhdGEtdG9vbHNldC1ibG9ja3MtZ3JpZD0iMTRlYzhhY2ZiYzY0YWY4ODg2Nzg5MGQ3OGFmNTY4YzkiXSA+IC50Yi1ncmlkLWNvbHVtbjpudGgtb2YtdHlwZSgybiArIDIpIHsgZ3JpZC1jb2x1bW46IDIgfSAud3AtYmxvY2stdG9vbHNldC1ibG9ja3MtZ3JpZC1jb2x1bW4udGItZ3JpZC1jb2x1bW5bZGF0YS10b29sc2V0LWJsb2Nrcy1ncmlkLWNvbHVtbj0iMzAzNGZiZTg4NmMxMTA1NGU5NWI0NmIwOWQzZTQxMTIiXSB7IGRpc3BsYXk6IGZsZXg7IH0gLnRiLWNvbnRhaW5lciAudGItY29udGFpbmVyLWlubmVye3dpZHRoOjEwMCU7bWFyZ2luOjAgYXV0b30gLnRiLWltYWdle3Bvc2l0aW9uOnJlbGF0aXZlO3RyYW5zaXRpb246dHJhbnNmb3JtIDAuMjVzIGVhc2V9LndwLWJsb2NrLWltYWdlIC50Yi1pbWFnZS5hbGlnbmNlbnRlcnttYXJnaW4tbGVmdDphdXRvO21hcmdpbi1yaWdodDphdXRvfS50Yi1pbWFnZSBpbWd7bWF4LXdpZHRoOjEwMCU7aGVpZ2h0OmF1dG87d2lkdGg6YXV0bzt0cmFuc2l0aW9uOnRyYW5zZm9ybSAwLjI1cyBlYXNlfS50Yi1pbWFnZSAudGItaW1hZ2UtY2FwdGlvbi1maXQtdG8taW1hZ2V7ZGlzcGxheTp0YWJsZX0udGItaW1hZ2UgLnRiLWltYWdlLWNhcHRpb24tZml0LXRvLWltYWdlIC50Yi1pbWFnZS1jYXB0aW9ue2Rpc3BsYXk6dGFibGUtY2FwdGlvbjtjYXB0aW9uLXNpZGU6Ym90dG9tfS50Yi1ncmlkLC50Yi1ncmlkPi5ibG9jay1lZGl0b3ItaW5uZXItYmxvY2tzPi5ibG9jay1lZGl0b3ItYmxvY2stbGlzdF9fbGF5b3V0e2Rpc3BsYXk6Z3JpZDtncmlkLXJvdy1nYXA6MjVweDtncmlkLWNvbHVtbi1nYXA6MjVweH0udGItZ3JpZC1pdGVte2JhY2tncm91bmQ6I2QzOGEwMztwYWRkaW5nOjMwcHh9LnRiLWdyaWQtY29sdW1ue2ZsZXgtd3JhcDp3cmFwfS50Yi1ncmlkLWNvbHVtbj4qe3dpZHRoOjEwMCV9LnRiLWdyaWQtY29sdW1uLnRiLWdyaWQtYWxpZ24tdG9we3dpZHRoOjEwMCU7ZGlzcGxheTpmbGV4O2FsaWduLWNvbnRlbnQ6ZmxleC1zdGFydH0udGItZ3JpZC1jb2x1bW4udGItZ3JpZC1hbGlnbi1jZW50ZXJ7d2lkdGg6MTAwJTtkaXNwbGF5OmZsZXg7YWxpZ24tY29udGVudDpjZW50ZXJ9LnRiLWdyaWQtY29sdW1uLnRiLWdyaWQtYWxpZ24tYm90dG9te3dpZHRoOjEwMCU7ZGlzcGxheTpmbGV4O2FsaWduLWNvbnRlbnQ6ZmxleC1lbmR9IC53cC1ibG9jay10b29sc2V0LWJsb2Nrcy1ncmlkLnRiLWdyaWRbZGF0YS10b29sc2V0LWJsb2Nrcy1ncmlkPSI0YjU1YWRmMWQzMzFmNDk2ZjhhM2I3OWJjNTkwMDczMCJdIHsgZ3JpZC10ZW1wbGF0ZS1jb2x1bW5zOiBtaW5tYXgoMCwgMC41ZnIpIG1pbm1heCgwLCAwLjVmcik7Z3JpZC1hdXRvLWZsb3c6IHJvdyB9IC53cC1ibG9jay10b29sc2V0LWJsb2Nrcy1ncmlkLnRiLWdyaWRbZGF0YS10b29sc2V0LWJsb2Nrcy1ncmlkPSI0YjU1YWRmMWQzMzFmNDk2ZjhhM2I3OWJjNTkwMDczMCJdID4gLnRiLWdyaWQtY29sdW1uOm50aC1vZi10eXBlKDJuICsgMSkgeyBncmlkLWNvbHVtbjogMSB9IC53cC1ibG9jay10b29sc2V0LWJsb2Nrcy1ncmlkLnRiLWdyaWRbZGF0YS10b29sc2V0LWJsb2Nrcy1ncmlkPSI0YjU1YWRmMWQzMzFmNDk2ZjhhM2I3OWJjNTkwMDczMCJdID4gLnRiLWdyaWQtY29sdW1uOm50aC1vZi10eXBlKDJuICsgMikgeyBncmlkLWNvbHVtbjogMiB9IC53cC1ibG9jay10b29sc2V0LWJsb2Nrcy1ncmlkLWNvbHVtbi50Yi1ncmlkLWNvbHVtbltkYXRhLXRvb2xzZXQtYmxvY2tzLWdyaWQtY29sdW1uPSI2ZTA4ZDFmNmQzY2M4MTc0M2JkZDA2Y2I4ZjhjYmUzYiJdIHsgZGlzcGxheTogZmxleDsgfSAudGItY29udGFpbmVyIC50Yi1jb250YWluZXItaW5uZXJ7d2lkdGg6MTAwJTttYXJnaW46MCBhdXRvfSAgLnRiLWltYWdle3Bvc2l0aW9uOnJlbGF0aXZlO3RyYW5zaXRpb246dHJhbnNmb3JtIDAuMjVzIGVhc2V9LndwLWJsb2NrLWltYWdlIC50Yi1pbWFnZS5hbGlnbmNlbnRlcnttYXJnaW4tbGVmdDphdXRvO21hcmdpbi1yaWdodDphdXRvfS50Yi1pbWFnZSBpbWd7bWF4LXdpZHRoOjEwMCU7aGVpZ2h0OmF1dG87d2lkdGg6YXV0bzt0cmFuc2l0aW9uOnRyYW5zZm9ybSAwLjI1cyBlYXNlfS50Yi1pbWFnZSAudGItaW1hZ2UtY2FwdGlvbi1maXQtdG8taW1hZ2V7ZGlzcGxheTp0YWJsZX0udGItaW1hZ2UgLnRiLWltYWdlLWNhcHRpb24tZml0LXRvLWltYWdlIC50Yi1pbWFnZS1jYXB0aW9ue2Rpc3BsYXk6dGFibGUtY2FwdGlvbjtjYXB0aW9uLXNpZGU6Ym90dG9tfS53cC1ibG9jay10b29sc2V0LWJsb2Nrcy1ncmlkLWNvbHVtbi50Yi1ncmlkLWNvbHVtbltkYXRhLXRvb2xzZXQtYmxvY2tzLWdyaWQtY29sdW1uPSIxNGViNTk4YzQ1NzM5MzZjNjFkNDQxNTlkNWVlYTQ0MiJdIHsgZGlzcGxheTogZmxleDsgfSAudGItY29udGFpbmVyIC50Yi1jb250YWluZXItaW5uZXJ7d2lkdGg6MTAwJTttYXJnaW46MCBhdXRvfSAudGItY29udGFpbmVyIC50Yi1jb250YWluZXItaW5uZXJ7d2lkdGg6MTAwJTttYXJnaW46MCBhdXRvfSB9IEBtZWRpYSBvbmx5IHNjcmVlbiBhbmQgKG1heC13aWR0aDogNTk5cHgpIHsgLnRiLWNvbnRhaW5lciAudGItY29udGFpbmVyLWlubmVye3dpZHRoOjEwMCU7bWFyZ2luOjAgYXV0b30udGItY29udGFpbmVyIC50Yi1jb250YWluZXItaW5uZXJ7d2lkdGg6MTAwJTttYXJnaW46MCBhdXRvfSAud3AtYmxvY2stdG9vbHNldC1ibG9ja3MtY29udGFpbmVyLnRiLWNvbnRhaW5lcltkYXRhLXRvb2xzZXQtYmxvY2tzLWNvbnRhaW5lcj0iOTQxZjcxZjZhZjUwOTQyM2YzOWQwYTUzZGU2ODQzMTYiXSB7IHBhZGRpbmctcmlnaHQ6IDE1cHg7cGFkZGluZy1sZWZ0OiAxNXB4OyB9IC50Yi1jb250YWluZXIgLnRiLWNvbnRhaW5lci1pbm5lcnt3aWR0aDoxMDAlO21hcmdpbjowIGF1dG99LnRiLWdyaWQsLnRiLWdyaWQ+LmJsb2NrLWVkaXRvci1pbm5lci1ibG9ja3M+LmJsb2NrLWVkaXRvci1ibG9jay1saXN0X19sYXlvdXR7ZGlzcGxheTpncmlkO2dyaWQtcm93LWdhcDoyNXB4O2dyaWQtY29sdW1uLWdhcDoyNXB4fS50Yi1ncmlkLWl0ZW17YmFja2dyb3VuZDojZDM4YTAzO3BhZGRpbmc6MzBweH0udGItZ3JpZC1jb2x1bW57ZmxleC13cmFwOndyYXB9LnRiLWdyaWQtY29sdW1uPip7d2lkdGg6MTAwJX0udGItZ3JpZC1jb2x1bW4udGItZ3JpZC1hbGlnbi10b3B7d2lkdGg6MTAwJTtkaXNwbGF5OmZsZXg7YWxpZ24tY29udGVudDpmbGV4LXN0YXJ0fS50Yi1ncmlkLWNvbHVtbi50Yi1ncmlkLWFsaWduLWNlbnRlcnt3aWR0aDoxMDAlO2Rpc3BsYXk6ZmxleDthbGlnbi1jb250ZW50OmNlbnRlcn0udGItZ3JpZC1jb2x1bW4udGItZ3JpZC1hbGlnbi1ib3R0b217d2lkdGg6MTAwJTtkaXNwbGF5OmZsZXg7YWxpZ24tY29udGVudDpmbGV4LWVuZH0gLndwLWJsb2NrLXRvb2xzZXQtYmxvY2tzLWdyaWQudGItZ3JpZFtkYXRhLXRvb2xzZXQtYmxvY2tzLWdyaWQ9IjE0ZWM4YWNmYmM2NGFmODg4Njc4OTBkNzhhZjU2OGM5Il0geyBncmlkLXRlbXBsYXRlLWNvbHVtbnM6IG1pbm1heCgwLCAxZnIpO2dyaWQtYXV0by1mbG93OiByb3cgfSAud3AtYmxvY2stdG9vbHNldC1ibG9ja3MtZ3JpZC50Yi1ncmlkW2RhdGEtdG9vbHNldC1ibG9ja3MtZ3JpZD0iMTRlYzhhY2ZiYzY0YWY4ODg2Nzg5MGQ3OGFmNTY4YzkiXSAgPiAudGItZ3JpZC1jb2x1bW46bnRoLW9mLXR5cGUoMW4rMSkgeyBncmlkLWNvbHVtbjogMSB9IC53cC1ibG9jay10b29sc2V0LWJsb2Nrcy1ncmlkLWNvbHVtbi50Yi1ncmlkLWNvbHVtbltkYXRhLXRvb2xzZXQtYmxvY2tzLWdyaWQtY29sdW1uPSIzMDM0ZmJlODg2YzExMDU0ZTk1YjQ2YjA5ZDNlNDExMiJdIHsgZGlzcGxheTogZmxleDsgfSAudGItY29udGFpbmVyIC50Yi1jb250YWluZXItaW5uZXJ7d2lkdGg6MTAwJTttYXJnaW46MCBhdXRvfSAudGItaW1hZ2V7cG9zaXRpb246cmVsYXRpdmU7dHJhbnNpdGlvbjp0cmFuc2Zvcm0gMC4yNXMgZWFzZX0ud3AtYmxvY2staW1hZ2UgLnRiLWltYWdlLmFsaWduY2VudGVye21hcmdpbi1sZWZ0OmF1dG87bWFyZ2luLXJpZ2h0OmF1dG99LnRiLWltYWdlIGltZ3ttYXgtd2lkdGg6MTAwJTtoZWlnaHQ6YXV0bzt3aWR0aDphdXRvO3RyYW5zaXRpb246dHJhbnNmb3JtIDAuMjVzIGVhc2V9LnRiLWltYWdlIC50Yi1pbWFnZS1jYXB0aW9uLWZpdC10by1pbWFnZXtkaXNwbGF5OnRhYmxlfS50Yi1pbWFnZSAudGItaW1hZ2UtY2FwdGlvbi1maXQtdG8taW1hZ2UgLnRiLWltYWdlLWNhcHRpb257ZGlzcGxheTp0YWJsZS1jYXB0aW9uO2NhcHRpb24tc2lkZTpib3R0b219LnRiLWdyaWQsLnRiLWdyaWQ+LmJsb2NrLWVkaXRvci1pbm5lci1ibG9ja3M+LmJsb2NrLWVkaXRvci1ibG9jay1saXN0X19sYXlvdXR7ZGlzcGxheTpncmlkO2dyaWQtcm93LWdhcDoyNXB4O2dyaWQtY29sdW1uLWdhcDoyNXB4fS50Yi1ncmlkLWl0ZW17YmFja2dyb3VuZDojZDM4YTAzO3BhZGRpbmc6MzBweH0udGItZ3JpZC1jb2x1bW57ZmxleC13cmFwOndyYXB9LnRiLWdyaWQtY29sdW1uPip7d2lkdGg6MTAwJX0udGItZ3JpZC1jb2x1bW4udGItZ3JpZC1hbGlnbi10b3B7d2lkdGg6MTAwJTtkaXNwbGF5OmZsZXg7YWxpZ24tY29udGVudDpmbGV4LXN0YXJ0fS50Yi1ncmlkLWNvbHVtbi50Yi1ncmlkLWFsaWduLWNlbnRlcnt3aWR0aDoxMDAlO2Rpc3BsYXk6ZmxleDthbGlnbi1jb250ZW50OmNlbnRlcn0udGItZ3JpZC1jb2x1bW4udGItZ3JpZC1hbGlnbi1ib3R0b217d2lkdGg6MTAwJTtkaXNwbGF5OmZsZXg7YWxpZ24tY29udGVudDpmbGV4LWVuZH0gLndwLWJsb2NrLXRvb2xzZXQtYmxvY2tzLWdyaWQudGItZ3JpZFtkYXRhLXRvb2xzZXQtYmxvY2tzLWdyaWQ9IjRiNTVhZGYxZDMzMWY0OTZmOGEzYjc5YmM1OTAwNzMwIl0geyBncmlkLXRlbXBsYXRlLWNvbHVtbnM6IG1pbm1heCgwLCAxZnIpO2dyaWQtYXV0by1mbG93OiByb3cgfSAud3AtYmxvY2stdG9vbHNldC1ibG9ja3MtZ3JpZC50Yi1ncmlkW2RhdGEtdG9vbHNldC1ibG9ja3MtZ3JpZD0iNGI1NWFkZjFkMzMxZjQ5NmY4YTNiNzliYzU5MDA3MzAiXSAgPiAudGItZ3JpZC1jb2x1bW46bnRoLW9mLXR5cGUoMW4rMSkgeyBncmlkLWNvbHVtbjogMSB9IC53cC1ibG9jay10b29sc2V0LWJsb2Nrcy1ncmlkLWNvbHVtbi50Yi1ncmlkLWNvbHVtbltkYXRhLXRvb2xzZXQtYmxvY2tzLWdyaWQtY29sdW1uPSI2ZTA4ZDFmNmQzY2M4MTc0M2JkZDA2Y2I4ZjhjYmUzYiJdIHsgZGlzcGxheTogZmxleDsgfSAudGItY29udGFpbmVyIC50Yi1jb250YWluZXItaW5uZXJ7d2lkdGg6MTAwJTttYXJnaW46MCBhdXRvfSAgLnRiLWltYWdle3Bvc2l0aW9uOnJlbGF0aXZlO3RyYW5zaXRpb246dHJhbnNmb3JtIDAuMjVzIGVhc2V9LndwLWJsb2NrLWltYWdlIC50Yi1pbWFnZS5hbGlnbmNlbnRlcnttYXJnaW4tbGVmdDphdXRvO21hcmdpbi1yaWdodDphdXRvfS50Yi1pbWFnZSBpbWd7bWF4LXdpZHRoOjEwMCU7aGVpZ2h0OmF1dG87d2lkdGg6YXV0bzt0cmFuc2l0aW9uOnRyYW5zZm9ybSAwLjI1cyBlYXNlfS50Yi1pbWFnZSAudGItaW1hZ2UtY2FwdGlvbi1maXQtdG8taW1hZ2V7ZGlzcGxheTp0YWJsZX0udGItaW1hZ2UgLnRiLWltYWdlLWNhcHRpb24tZml0LXRvLWltYWdlIC50Yi1pbWFnZS1jYXB0aW9ue2Rpc3BsYXk6dGFibGUtY2FwdGlvbjtjYXB0aW9uLXNpZGU6Ym90dG9tfS53cC1ibG9jay10b29sc2V0LWJsb2Nrcy1ncmlkLWNvbHVtbi50Yi1ncmlkLWNvbHVtbltkYXRhLXRvb2xzZXQtYmxvY2tzLWdyaWQtY29sdW1uPSIxNGViNTk4YzQ1NzM5MzZjNjFkNDQxNTlkNWVlYTQ0MiJdIHsgZGlzcGxheTogZmxleDsgfSAudGItZmllbGRzLWFuZC10ZXh0W2RhdGEtdG9vbHNldC1ibG9ja3MtZmllbGRzLWFuZC10ZXh0PSIwNWM3MTJhNWEyMmI1OWRmMWJlNGQyODQ4NzA1ZDMzNSJdIHsgZm9udC1zaXplOiAyNHB4O2xpbmUtaGVpZ2h0OiAzMnB4OyB9IC50Yi1maWVsZHMtYW5kLXRleHRbZGF0YS10b29sc2V0LWJsb2Nrcy1maWVsZHMtYW5kLXRleHQ9IjA1YzcxMmE1YTIyYjU5ZGYxYmU0ZDI4NDg3MDVkMzM1Il0gcCB7IGZvbnQtc2l6ZTogMjRweDtsaW5lLWhlaWdodDogMzJweDsgfSAudGItY29udGFpbmVyIC50Yi1jb250YWluZXItaW5uZXJ7d2lkdGg6MTAwJTttYXJnaW46MCBhdXRvfWgxLnRiLWhlYWRpbmdbZGF0YS10b29sc2V0LWJsb2Nrcy1oZWFkaW5nPSI3ODJkMWZhOGI4NjdjZWUzZTI2OTc4MTdlMTg3MmFkYSJdICB7IGZvbnQtc2l6ZTogNDhweDtsaW5lLWhlaWdodDogNDBweDsgfSAgLnRiLWNvbnRhaW5lciAudGItY29udGFpbmVyLWlubmVye3dpZHRoOjEwMCU7bWFyZ2luOjAgYXV0b30gfSA=
These changes are due to variations in ocean temperatures that give rise to a complex cycle that occurs every several years. And this winter, these variations are the strongest since records have been kept.
Have you noticed any changes in the temperature and precipitation patterns lately? In some locations, perhaps you experienced warmer than average temperatures and more precipitation, while other locations were having rare droughts and colder temperatures. You may have heard that we have been experiencing a very “strong El Niño” in fall 2015 and winter 2016. Indeed, scientists have verified that this El Niño event has tied the 1997-98 El Niño, which was previously the strongest on record. These records have been kept since 1950, not a lengthy period of time by scientific research standards.
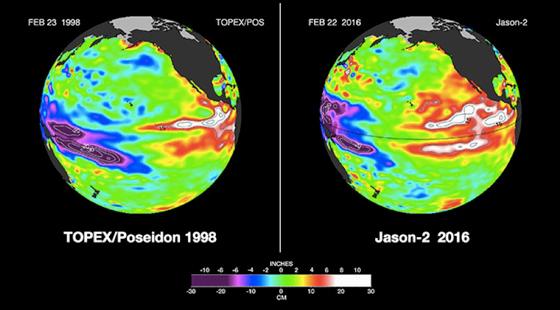
The image above shows side-by-side comparisons of Pacific Ocean sea surface height (SSH) anomalies during the famous 1997-1998 El Niño and what is presently happening in 2015-2016 with the Pacific Ocean signal. These 1997-1998 and 2015-2016 El Niño animations were made from data collected by the TOPEX/Poseidon (1997-1998) and the OSTM/Jason-2 (2015-2016) satellites. Image credit: NASA/JPL-Caltech
What is an El Niño?
It is actually very simple, especially for those who sail the seas. The El Niño is a periodic warming of the central and eastern equatorial Pacific Ocean. These ocean temperature changes disrupt the large-scale air movements in the tropics. Once that occurs, there are a multitude of side effects that take place, thus altering typical weather patterns. Scientists really don’t understand why, but this ocean pattern appears every two to seven years, and warms this patch of the ocean for six to 18 months, and then cools. El Niño and La Niña are opposite phases of a natural climate pattern across the tropical Pacific Ocean, and they appear to swing back and forth in this unusual rhythm. This is known as the ENSO, which is short for El Niño-Southern Oscillation. The ENSO pattern has three phases: El Niño is the warmer phase, La Niña the cooler phase, and wouldn’t you know it — the middle phase is known simply as “neutral.”
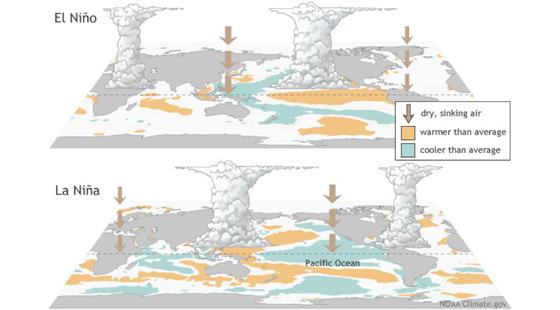
El Niño/La Niña are shifts in ocean temperature in the Pacific Ocean, shown in the red to blue contours on the surface in the diagram above. The Southern Oscillation is the atmospheric pressure change between Tahiti and Darwin, Australia, which affects the strength and direction of the winds. Together the shifts in temperature and pressure are referred to as ENSO. Image credit: climate.gov
For those of you who understand Spanish, you may know that literally, El Niño means “the boy child.” It also can mean the “Christ Child” for South Americans, and that is how it got its name. Fishermen off the coast of South America were the first people to notice that sometimes there were unusual spells of warmer water that came around Christmas time. When they noticed the water was warmer and the fishing became poor, they would stop fishing for that season and instead repair their nets. Makes sense!
Weather Pattern Disruptions
What is especially fascinating about this disruption of typical weather patterns is that the changes vary so much from location to location. Weather disruptions and extreme events occurred all over the world, click here to view world map of events in November 2015 . Even here in the U.S., the impacts on our weather are very diverse.
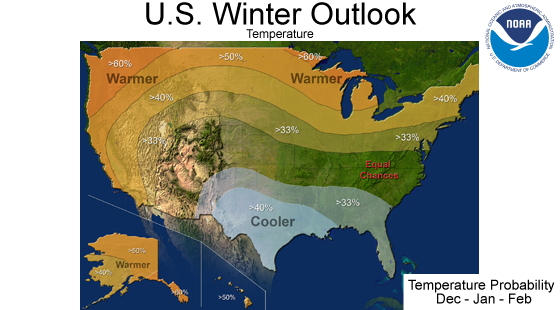
Below are two maps from NOAA that give the predictions for atypical temperature and precipitation patterns. As you will notice, the confidence in the predicted weather changes varies, and in some locations no weather pattern changes are anticipated. Generally, the El Niño brings cooler and wetter weather to the southern U.S., and warmer weather to western Canada and southern Alaska. The Pacific Northwest experiences drier weather, while northern Canada has cooler weather. The good news is that southern California will usually have wetter weather, and indeed that has been the case. Unfortunately though, the water deficit left from four years of drought is too large for one El Niño year to totally overcome.
Image credit: NOAA
Improving Our Understanding
Using observations from 19 Earth observing satellites together with supercomputer processing power for modeling systems, scientists have an impressive suite of tools to analyze El Niño events and their global impacts as never before. Earth’s oceans have the greatest influence on global climate, and it is only from space that we can observe our vast oceans on a global scale. This allows us to monitor critical changes in ocean currents and heat storage.
The continuous data from satellites like TOPEX/Poseidon and Jason help us understand and foresee the effects of the changing oceans on our climate as well as climate events such as El Niño and La Niña. NASA scientists are learning how El Niño affects the year-to-year variability for the fire seasons in the western United States, Amazon and Indonesia. We are also looking at how the El Niño may also affect the yearly variability of the ground-level pollutant ozone that severely affects human health. Researchers are very interested to learn how the current El Niño will affect the ongoing drought in California.


