LnRiLWNvbnRhaW5lciAudGItY29udGFpbmVyLWlubmVye3dpZHRoOjEwMCU7bWFyZ2luOjAgYXV0b30gLndwLWJsb2NrLXRvb2xzZXQtYmxvY2tzLWNvbnRhaW5lci50Yi1jb250YWluZXJbZGF0YS10b29sc2V0LWJsb2Nrcy1jb250YWluZXI9IjUwZWUyMTY1MTllYzRkYWJkNWZkNmIwMGQ2N2Y4MWRmIl0geyBwYWRkaW5nOiAyNXB4IDI1cHggMHB4IDI1cHg7IH0gLndwLWJsb2NrLXRvb2xzZXQtYmxvY2tzLWNvbnRhaW5lci50Yi1jb250YWluZXJbZGF0YS10b29sc2V0LWJsb2Nrcy1jb250YWluZXI9IjUwZWUyMTY1MTllYzRkYWJkNWZkNmIwMGQ2N2Y4MWRmIl0gPiAudGItY29udGFpbmVyLWlubmVyIHsgbWF4LXdpZHRoOiAxMjAwcHg7IH0gLnRiLWNvbnRhaW5lciAudGItY29udGFpbmVyLWlubmVye3dpZHRoOjEwMCU7bWFyZ2luOjAgYXV0b30gLndwLWJsb2NrLXRvb2xzZXQtYmxvY2tzLWNvbnRhaW5lci50Yi1jb250YWluZXJbZGF0YS10b29sc2V0LWJsb2Nrcy1jb250YWluZXI9Ijk0MWY3MWY2YWY1MDk0MjNmMzlkMGE1M2RlNjg0MzE2Il0geyBiYWNrZ3JvdW5kOiByZ2JhKCAyNTUsIDI1NSwgMjU1LCAxICk7cGFkZGluZzogNDVweDttYXJnaW4tdG9wOiAtMTAwcHg7Ym94LXNoYWRvdzogMXB4IC0xcHggMTBweCAwIHJnYmEoIDAsIDAsIDAsIDAuNSApO21pbi1oZWlnaHQ6IDYwMHB4OyB9IC50Yi1jb250YWluZXIgLnRiLWNvbnRhaW5lci1pbm5lcnt3aWR0aDoxMDAlO21hcmdpbjowIGF1dG99IC53cC1ibG9jay10b29sc2V0LWJsb2Nrcy1jb250YWluZXIudGItY29udGFpbmVyW2RhdGEtdG9vbHNldC1ibG9ja3MtY29udGFpbmVyPSIzZmNkODI0ZGMxNzQ0ZjY3NGJhYTExOWUzMGI2ZWUyNSJdIHsgYmFja2dyb3VuZDogcmdiYSggOTMsIDE3MywgMTk2LCAxICk7cGFkZGluZzogMjVweDsgfSAudGItZ3JpZCwudGItZ3JpZD4uYmxvY2stZWRpdG9yLWlubmVyLWJsb2Nrcz4uYmxvY2stZWRpdG9yLWJsb2NrLWxpc3RfX2xheW91dHtkaXNwbGF5OmdyaWQ7Z3JpZC1yb3ctZ2FwOjI1cHg7Z3JpZC1jb2x1bW4tZ2FwOjI1cHh9LnRiLWdyaWQtaXRlbXtiYWNrZ3JvdW5kOiNkMzhhMDM7cGFkZGluZzozMHB4fS50Yi1ncmlkLWNvbHVtbntmbGV4LXdyYXA6d3JhcH0udGItZ3JpZC1jb2x1bW4+Knt3aWR0aDoxMDAlfS50Yi1ncmlkLWNvbHVtbi50Yi1ncmlkLWFsaWduLXRvcHt3aWR0aDoxMDAlO2Rpc3BsYXk6ZmxleDthbGlnbi1jb250ZW50OmZsZXgtc3RhcnR9LnRiLWdyaWQtY29sdW1uLnRiLWdyaWQtYWxpZ24tY2VudGVye3dpZHRoOjEwMCU7ZGlzcGxheTpmbGV4O2FsaWduLWNvbnRlbnQ6Y2VudGVyfS50Yi1ncmlkLWNvbHVtbi50Yi1ncmlkLWFsaWduLWJvdHRvbXt3aWR0aDoxMDAlO2Rpc3BsYXk6ZmxleDthbGlnbi1jb250ZW50OmZsZXgtZW5kfSAud3AtYmxvY2stdG9vbHNldC1ibG9ja3MtZ3JpZC50Yi1ncmlkW2RhdGEtdG9vbHNldC1ibG9ja3MtZ3JpZD0iMTRlYzhhY2ZiYzY0YWY4ODg2Nzg5MGQ3OGFmNTY4YzkiXSB7IGdyaWQtdGVtcGxhdGUtY29sdW1uczogbWlubWF4KDAsIDAuMzM1ZnIpIG1pbm1heCgwLCAwLjY2NWZyKTtncmlkLWF1dG8tZmxvdzogcm93IH0gLndwLWJsb2NrLXRvb2xzZXQtYmxvY2tzLWdyaWQudGItZ3JpZFtkYXRhLXRvb2xzZXQtYmxvY2tzLWdyaWQ9IjE0ZWM4YWNmYmM2NGFmODg4Njc4OTBkNzhhZjU2OGM5Il0gPiAudGItZ3JpZC1jb2x1bW46bnRoLW9mLXR5cGUoMm4gKyAxKSB7IGdyaWQtY29sdW1uOiAxIH0gLndwLWJsb2NrLXRvb2xzZXQtYmxvY2tzLWdyaWQudGItZ3JpZFtkYXRhLXRvb2xzZXQtYmxvY2tzLWdyaWQ9IjE0ZWM4YWNmYmM2NGFmODg4Njc4OTBkNzhhZjU2OGM5Il0gPiAudGItZ3JpZC1jb2x1bW46bnRoLW9mLXR5cGUoMm4gKyAyKSB7IGdyaWQtY29sdW1uOiAyIH0gLnRiLWZpZWxkcy1hbmQtdGV4dFtkYXRhLXRvb2xzZXQtYmxvY2tzLWZpZWxkcy1hbmQtdGV4dD0iNDY3MDMzZjZmOWI1YTMwZDdhMGJlYzdjYjJiMzgyYTUiXSB7IGZvbnQtc2l6ZTogMTZweDtsaW5lLWhlaWdodDogNDBweDtjb2xvcjogcmdiYSggMjU1LCAyNTUsIDI1NSwgMSApO21hcmdpbi10b3A6IDQwcHg7IH0gLnRiLWZpZWxkcy1hbmQtdGV4dFtkYXRhLXRvb2xzZXQtYmxvY2tzLWZpZWxkcy1hbmQtdGV4dD0iNDY3MDMzZjZmOWI1YTMwZDdhMGJlYzdjYjJiMzgyYTUiXSBwIHsgZm9udC1zaXplOiAxNnB4O2xpbmUtaGVpZ2h0OiA0MHB4O2NvbG9yOiByZ2JhKCAyNTUsIDI1NSwgMjU1LCAxICk7IH0gLndwLWJsb2NrLXRvb2xzZXQtYmxvY2tzLWdyaWQtY29sdW1uLnRiLWdyaWQtY29sdW1uW2RhdGEtdG9vbHNldC1ibG9ja3MtZ3JpZC1jb2x1bW49IjMwMzRmYmU4ODZjMTEwNTRlOTViNDZiMDlkM2U0MTEyIl0geyBkaXNwbGF5OiBmbGV4OyB9IC50Yi1jb250YWluZXIgLnRiLWNvbnRhaW5lci1pbm5lcnt3aWR0aDoxMDAlO21hcmdpbjowIGF1dG99IC53cC1ibG9jay10b29sc2V0LWJsb2Nrcy1jb250YWluZXIudGItY29udGFpbmVyW2RhdGEtdG9vbHNldC1ibG9ja3MtY29udGFpbmVyPSJlZDM4MzJhYTYyMDFjYmVjNWIxZTViOTAyZGMwNjdlMiJdIHsgcGFkZGluZzogMjVweDsgfSAudGItaGVhZGluZ1tkYXRhLXRvb2xzZXQtYmxvY2tzLWhlYWRpbmc9ImU3NmFkMWRiZWY2ZTEzNmJjZDcyMGIxYTM1ZjFlZGIzIl0gIHsgZm9udC1zaXplOiAyMHB4O2NvbG9yOiByZ2JhKCAyNTUsIDI1NSwgMjU1LCAxICk7bWFyZ2luLXRvcDogMTVweDsgfSAgLnRiLWltYWdle3Bvc2l0aW9uOnJlbGF0aXZlO3RyYW5zaXRpb246dHJhbnNmb3JtIDAuMjVzIGVhc2V9LndwLWJsb2NrLWltYWdlIC50Yi1pbWFnZS5hbGlnbmNlbnRlcnttYXJnaW4tbGVmdDphdXRvO21hcmdpbi1yaWdodDphdXRvfS50Yi1pbWFnZSBpbWd7bWF4LXdpZHRoOjEwMCU7aGVpZ2h0OmF1dG87d2lkdGg6YXV0bzt0cmFuc2l0aW9uOnRyYW5zZm9ybSAwLjI1cyBlYXNlfS50Yi1pbWFnZSAudGItaW1hZ2UtY2FwdGlvbi1maXQtdG8taW1hZ2V7ZGlzcGxheTp0YWJsZX0udGItaW1hZ2UgLnRiLWltYWdlLWNhcHRpb24tZml0LXRvLWltYWdlIC50Yi1pbWFnZS1jYXB0aW9ue2Rpc3BsYXk6dGFibGUtY2FwdGlvbjtjYXB0aW9uLXNpZGU6Ym90dG9tfSAud3AtYmxvY2staW1hZ2UudGItaW1hZ2VbZGF0YS10b29sc2V0LWJsb2Nrcy1pbWFnZT0iNzRkZWZlMmM0NDRlMWEwMWQ1MjY2YjJiMjZjZmVkZDMiXSB7IG1heC13aWR0aDogMTAwJTsgfSAudGItZ3JpZCwudGItZ3JpZD4uYmxvY2stZWRpdG9yLWlubmVyLWJsb2Nrcz4uYmxvY2stZWRpdG9yLWJsb2NrLWxpc3RfX2xheW91dHtkaXNwbGF5OmdyaWQ7Z3JpZC1yb3ctZ2FwOjI1cHg7Z3JpZC1jb2x1bW4tZ2FwOjI1cHh9LnRiLWdyaWQtaXRlbXtiYWNrZ3JvdW5kOiNkMzhhMDM7cGFkZGluZzozMHB4fS50Yi1ncmlkLWNvbHVtbntmbGV4LXdyYXA6d3JhcH0udGItZ3JpZC1jb2x1bW4+Knt3aWR0aDoxMDAlfS50Yi1ncmlkLWNvbHVtbi50Yi1ncmlkLWFsaWduLXRvcHt3aWR0aDoxMDAlO2Rpc3BsYXk6ZmxleDthbGlnbi1jb250ZW50OmZsZXgtc3RhcnR9LnRiLWdyaWQtY29sdW1uLnRiLWdyaWQtYWxpZ24tY2VudGVye3dpZHRoOjEwMCU7ZGlzcGxheTpmbGV4O2FsaWduLWNvbnRlbnQ6Y2VudGVyfS50Yi1ncmlkLWNvbHVtbi50Yi1ncmlkLWFsaWduLWJvdHRvbXt3aWR0aDoxMDAlO2Rpc3BsYXk6ZmxleDthbGlnbi1jb250ZW50OmZsZXgtZW5kfSAud3AtYmxvY2stdG9vbHNldC1ibG9ja3MtZ3JpZC50Yi1ncmlkW2RhdGEtdG9vbHNldC1ibG9ja3MtZ3JpZD0iNGI1NWFkZjFkMzMxZjQ5NmY4YTNiNzliYzU5MDA3MzAiXSB7IGdyaWQtdGVtcGxhdGUtY29sdW1uczogbWlubWF4KDAsIDAuODA1ZnIpIG1pbm1heCgwLCAwLjE5NWZyKTtncmlkLWF1dG8tZmxvdzogcm93IH0gLndwLWJsb2NrLXRvb2xzZXQtYmxvY2tzLWdyaWQudGItZ3JpZFtkYXRhLXRvb2xzZXQtYmxvY2tzLWdyaWQ9IjRiNTVhZGYxZDMzMWY0OTZmOGEzYjc5YmM1OTAwNzMwIl0gPiAudGItZ3JpZC1jb2x1bW46bnRoLW9mLXR5cGUoMm4gKyAxKSB7IGdyaWQtY29sdW1uOiAxIH0gLndwLWJsb2NrLXRvb2xzZXQtYmxvY2tzLWdyaWQudGItZ3JpZFtkYXRhLXRvb2xzZXQtYmxvY2tzLWdyaWQ9IjRiNTVhZGYxZDMzMWY0OTZmOGEzYjc5YmM1OTAwNzMwIl0gPiAudGItZ3JpZC1jb2x1bW46bnRoLW9mLXR5cGUoMm4gKyAyKSB7IGdyaWQtY29sdW1uOiAyIH0gLndwLWJsb2NrLXRvb2xzZXQtYmxvY2tzLWdyaWQtY29sdW1uLnRiLWdyaWQtY29sdW1uW2RhdGEtdG9vbHNldC1ibG9ja3MtZ3JpZC1jb2x1bW49IjZlMDhkMWY2ZDNjYzgxNzQzYmRkMDZjYjhmOGNiZTNiIl0geyBwYWRkaW5nLXRvcDogMjVweDtkaXNwbGF5OiBmbGV4OyB9IC50Yi1jb250YWluZXIgLnRiLWNvbnRhaW5lci1pbm5lcnt3aWR0aDoxMDAlO21hcmdpbjowIGF1dG99IC53cC1ibG9jay10b29sc2V0LWJsb2Nrcy1jb250YWluZXIudGItY29udGFpbmVyW2RhdGEtdG9vbHNldC1ibG9ja3MtY29udGFpbmVyPSI3NmI5ZTE5YWViZDc4YjQ2N2IwNGM2NGFjZmUzMzE2NyJdIHsgcGFkZGluZzogMHB4OyB9IGgyLnRiLWhlYWRpbmdbZGF0YS10b29sc2V0LWJsb2Nrcy1oZWFkaW5nPSI0YzllYTlkNDYyZGI0MWZhOThhYzNjN2U1MTNhYjhmNiJdICB7IGZvbnQtc2l6ZTogMTZweDt0ZXh0LWRlY29yYXRpb246IG5vbmU7IH0gIGgyLnRiLWhlYWRpbmdbZGF0YS10b29sc2V0LWJsb2Nrcy1oZWFkaW5nPSJjOWZhZDk4NmFmMGQ0M2IwNTFhN2EzZGNlYWQyNjk0MSJdICB7IGZvbnQtc2l6ZTogMThweDtjb2xvcjogcmdiYSggMzQsIDg0LCAxMTgsIDEgKTt0ZXh0LWFsaWduOiBjZW50ZXI7bWFyZ2luLXRvcDogMTBweDsgfSAgLnRiLWltYWdle3Bvc2l0aW9uOnJlbGF0aXZlO3RyYW5zaXRpb246dHJhbnNmb3JtIDAuMjVzIGVhc2V9LndwLWJsb2NrLWltYWdlIC50Yi1pbWFnZS5hbGlnbmNlbnRlcnttYXJnaW4tbGVmdDphdXRvO21hcmdpbi1yaWdodDphdXRvfS50Yi1pbWFnZSBpbWd7bWF4LXdpZHRoOjEwMCU7aGVpZ2h0OmF1dG87d2lkdGg6YXV0bzt0cmFuc2l0aW9uOnRyYW5zZm9ybSAwLjI1cyBlYXNlfS50Yi1pbWFnZSAudGItaW1hZ2UtY2FwdGlvbi1maXQtdG8taW1hZ2V7ZGlzcGxheTp0YWJsZX0udGItaW1hZ2UgLnRiLWltYWdlLWNhcHRpb24tZml0LXRvLWltYWdlIC50Yi1pbWFnZS1jYXB0aW9ue2Rpc3BsYXk6dGFibGUtY2FwdGlvbjtjYXB0aW9uLXNpZGU6Ym90dG9tfSAud3AtYmxvY2staW1hZ2UudGItaW1hZ2VbZGF0YS10b29sc2V0LWJsb2Nrcy1pbWFnZT0iM2RhYWViMzdjMGZmYjA3MDVjNGViMWVkNTBlOGQ5MzUiXSB7IG1heC13aWR0aDogMTAwJTsgfSAud3AtYmxvY2stdG9vbHNldC1ibG9ja3MtZ3JpZC1jb2x1bW4udGItZ3JpZC1jb2x1bW5bZGF0YS10b29sc2V0LWJsb2Nrcy1ncmlkLWNvbHVtbj0iMTRlYjU5OGM0NTczOTM2YzYxZDQ0MTU5ZDVlZWE0NDIiXSB7IGRpc3BsYXk6IGZsZXg7IH0gLnRiLWZpZWxkcy1hbmQtdGV4dFtkYXRhLXRvb2xzZXQtYmxvY2tzLWZpZWxkcy1hbmQtdGV4dD0iMDVjNzEyYTVhMjJiNTlkZjFiZTRkMjg0ODcwNWQzMzUiXSB7IGZvbnQtc2l6ZTogMjRweDtsaW5lLWhlaWdodDogNDBweDtjb2xvcjogcmdiYSggMzQsIDg0LCAxMTgsIDEgKTsgfSAudGItZmllbGRzLWFuZC10ZXh0W2RhdGEtdG9vbHNldC1ibG9ja3MtZmllbGRzLWFuZC10ZXh0PSIwNWM3MTJhNWEyMmI1OWRmMWJlNGQyODQ4NzA1ZDMzNSJdIHAgeyBmb250LXNpemU6IDI0cHg7bGluZS1oZWlnaHQ6IDQwcHg7Y29sb3I6IHJnYmEoIDM0LCA4NCwgMTE4LCAxICk7IH0gLnRiLWNvbnRhaW5lciAudGItY29udGFpbmVyLWlubmVye3dpZHRoOjEwMCU7bWFyZ2luOjAgYXV0b30gLndwLWJsb2NrLXRvb2xzZXQtYmxvY2tzLWNvbnRhaW5lci50Yi1jb250YWluZXJbZGF0YS10b29sc2V0LWJsb2Nrcy1jb250YWluZXI9ImEyMWI5OTg4MDg3MjNjOGFiMzU4MWNkMzIwM2ZiYmUzIl0geyBiYWNrZ3JvdW5kOmxpbmVhci1ncmFkaWVudChyZ2JhKCAwLCAwLCAwLCAwLjMyICkscmdiYSggMCwgMCwgMCwgMC4zMiApKSwgIHJnYmEoIDI1NSwgMjU1LCAyNTUsIDAgKSB1cmwoJycpIGNlbnRlciBjZW50ZXIgbm8tcmVwZWF0O2JhY2tncm91bmQtc2l6ZTphdXRvLCBjb3ZlcjtwYWRkaW5nOiAyNXB4O21hcmdpbi10b3A6IC01MDBweDttaW4taGVpZ2h0OiA1MDBweDtkaXNwbGF5Om1zLWZsZXhib3ggIWltcG9ydGFudDtkaXNwbGF5OmZsZXggIWltcG9ydGFudDstbXMtZmxleC1kaXJlY3Rpb246Y29sdW1uO2ZsZXgtZGlyZWN0aW9uOmNvbHVtbjstbXMtZmxleC1wYWNrOmNlbnRlcjtqdXN0aWZ5LWNvbnRlbnQ6Y2VudGVyOyB9IC53cC1ibG9jay10b29sc2V0LWJsb2Nrcy1jb250YWluZXIudGItY29udGFpbmVyW2RhdGEtdG9vbHNldC1ibG9ja3MtY29udGFpbmVyPSJhMjFiOTk4ODA4NzIzYzhhYjM1ODFjZDMyMDNmYmJlMyJdID4gLnRiLWNvbnRhaW5lci1pbm5lciB7IG1heC13aWR0aDogMTIwMHB4OyB9IC53cC1ibG9jay10b29sc2V0LWJsb2Nrcy1jb250YWluZXIudGItY29udGFpbmVyW2RhdGEtdG9vbHNldC1ibG9ja3MtY29udGFpbmVyPSJhMjFiOTk4ODA4NzIzYzhhYjM1ODFjZDMyMDNmYmJlMyJdIHAgeyBsZXR0ZXItc3BhY2luZzogMHB4OyB9IC50Yi1maWVsZHMtYW5kLXRleHRbZGF0YS10b29sc2V0LWJsb2Nrcy1maWVsZHMtYW5kLXRleHQ9ImVkMzgwMWMyMjk1ZDQ1N2E0MTg3NzdjMzgyNGRmMWIzIl0geyBmb250LXNpemU6IDIwcHg7Y29sb3I6IHJnYmEoIDI1NSwgMjU1LCAyNTUsIDEgKTsgfSAudGItZmllbGRzLWFuZC10ZXh0W2RhdGEtdG9vbHNldC1ibG9ja3MtZmllbGRzLWFuZC10ZXh0PSJlZDM4MDFjMjI5NWQ0NTdhNDE4Nzc3YzM4MjRkZjFiMyJdIHAgeyBmb250LXNpemU6IDIwcHg7Y29sb3I6IHJnYmEoIDI1NSwgMjU1LCAyNTUsIDEgKTsgfSBoMS50Yi1oZWFkaW5nW2RhdGEtdG9vbHNldC1ibG9ja3MtaGVhZGluZz0iNzgyZDFmYThiODY3Y2VlM2UyNjk3ODE3ZTE4NzJhZGEiXSAgeyBmb250LXNpemU6IDY0cHg7bGluZS1oZWlnaHQ6IDUycHg7bGV0dGVyLXNwYWNpbmc6IDBweDt0ZXh0LXRyYW5zZm9ybTogdXBwZXJjYXNlO2NvbG9yOiByZ2JhKCAyNTUsIDI1NSwgMjU1LCAxICk7dGV4dC1hbGlnbjogY2VudGVyO3BhZGRpbmctdG9wOiAwcHg7cGFkZGluZy1ib3R0b206IDBweDttYXJnaW4tdG9wOiA3NXB4O21hcmdpbi1ib3R0b206IDBweDsgfSAgLnRiLWNvbnRhaW5lciAudGItY29udGFpbmVyLWlubmVye3dpZHRoOjEwMCU7bWFyZ2luOjAgYXV0b30gLndwLWJsb2NrLXRvb2xzZXQtYmxvY2tzLWNvbnRhaW5lci50Yi1jb250YWluZXJbZGF0YS10b29sc2V0LWJsb2Nrcy1jb250YWluZXI9IjM2NjdlNzYzMWM0MjhjNzA0YjI5NjdiZGJhNzAxYTJiIl0geyBiYWNrZ3JvdW5kOmxpbmVhci1ncmFkaWVudChyZ2JhKCAyNTUsIDI1NSwgMjU1LCAwICkscmdiYSggMjU1LCAyNTUsIDI1NSwgMCApKSwgIHJnYmEoIDAsIDAsIDAsIDEgKSB1cmwoJycpIGNlbnRlciB0b3Agbm8tcmVwZWF0O2JhY2tncm91bmQtc2l6ZTphdXRvLCBjb3ZlcjtwYWRkaW5nOiAwcHg7bWFyZ2luOiAwcHg7bWluLWhlaWdodDogNTAwcHg7IH0gQG1lZGlhIG9ubHkgc2NyZWVuIGFuZCAobWF4LXdpZHRoOiA3ODFweCkgeyAudGItY29udGFpbmVyIC50Yi1jb250YWluZXItaW5uZXJ7d2lkdGg6MTAwJTttYXJnaW46MCBhdXRvfS50Yi1jb250YWluZXIgLnRiLWNvbnRhaW5lci1pbm5lcnt3aWR0aDoxMDAlO21hcmdpbjowIGF1dG99LnRiLWNvbnRhaW5lciAudGItY29udGFpbmVyLWlubmVye3dpZHRoOjEwMCU7bWFyZ2luOjAgYXV0b30udGItZ3JpZCwudGItZ3JpZD4uYmxvY2stZWRpdG9yLWlubmVyLWJsb2Nrcz4uYmxvY2stZWRpdG9yLWJsb2NrLWxpc3RfX2xheW91dHtkaXNwbGF5OmdyaWQ7Z3JpZC1yb3ctZ2FwOjI1cHg7Z3JpZC1jb2x1bW4tZ2FwOjI1cHh9LnRiLWdyaWQtaXRlbXtiYWNrZ3JvdW5kOiNkMzhhMDM7cGFkZGluZzozMHB4fS50Yi1ncmlkLWNvbHVtbntmbGV4LXdyYXA6d3JhcH0udGItZ3JpZC1jb2x1bW4+Knt3aWR0aDoxMDAlfS50Yi1ncmlkLWNvbHVtbi50Yi1ncmlkLWFsaWduLXRvcHt3aWR0aDoxMDAlO2Rpc3BsYXk6ZmxleDthbGlnbi1jb250ZW50OmZsZXgtc3RhcnR9LnRiLWdyaWQtY29sdW1uLnRiLWdyaWQtYWxpZ24tY2VudGVye3dpZHRoOjEwMCU7ZGlzcGxheTpmbGV4O2FsaWduLWNvbnRlbnQ6Y2VudGVyfS50Yi1ncmlkLWNvbHVtbi50Yi1ncmlkLWFsaWduLWJvdHRvbXt3aWR0aDoxMDAlO2Rpc3BsYXk6ZmxleDthbGlnbi1jb250ZW50OmZsZXgtZW5kfSAud3AtYmxvY2stdG9vbHNldC1ibG9ja3MtZ3JpZC50Yi1ncmlkW2RhdGEtdG9vbHNldC1ibG9ja3MtZ3JpZD0iMTRlYzhhY2ZiYzY0YWY4ODg2Nzg5MGQ3OGFmNTY4YzkiXSB7IGdyaWQtdGVtcGxhdGUtY29sdW1uczogbWlubWF4KDAsIDAuNWZyKSBtaW5tYXgoMCwgMC41ZnIpO2dyaWQtYXV0by1mbG93OiByb3cgfSAud3AtYmxvY2stdG9vbHNldC1ibG9ja3MtZ3JpZC50Yi1ncmlkW2RhdGEtdG9vbHNldC1ibG9ja3MtZ3JpZD0iMTRlYzhhY2ZiYzY0YWY4ODg2Nzg5MGQ3OGFmNTY4YzkiXSA+IC50Yi1ncmlkLWNvbHVtbjpudGgtb2YtdHlwZSgybiArIDEpIHsgZ3JpZC1jb2x1bW46IDEgfSAud3AtYmxvY2stdG9vbHNldC1ibG9ja3MtZ3JpZC50Yi1ncmlkW2RhdGEtdG9vbHNldC1ibG9ja3MtZ3JpZD0iMTRlYzhhY2ZiYzY0YWY4ODg2Nzg5MGQ3OGFmNTY4YzkiXSA+IC50Yi1ncmlkLWNvbHVtbjpudGgtb2YtdHlwZSgybiArIDIpIHsgZ3JpZC1jb2x1bW46IDIgfSAud3AtYmxvY2stdG9vbHNldC1ibG9ja3MtZ3JpZC1jb2x1bW4udGItZ3JpZC1jb2x1bW5bZGF0YS10b29sc2V0LWJsb2Nrcy1ncmlkLWNvbHVtbj0iMzAzNGZiZTg4NmMxMTA1NGU5NWI0NmIwOWQzZTQxMTIiXSB7IGRpc3BsYXk6IGZsZXg7IH0gLnRiLWNvbnRhaW5lciAudGItY29udGFpbmVyLWlubmVye3dpZHRoOjEwMCU7bWFyZ2luOjAgYXV0b30gLnRiLWltYWdle3Bvc2l0aW9uOnJlbGF0aXZlO3RyYW5zaXRpb246dHJhbnNmb3JtIDAuMjVzIGVhc2V9LndwLWJsb2NrLWltYWdlIC50Yi1pbWFnZS5hbGlnbmNlbnRlcnttYXJnaW4tbGVmdDphdXRvO21hcmdpbi1yaWdodDphdXRvfS50Yi1pbWFnZSBpbWd7bWF4LXdpZHRoOjEwMCU7aGVpZ2h0OmF1dG87d2lkdGg6YXV0bzt0cmFuc2l0aW9uOnRyYW5zZm9ybSAwLjI1cyBlYXNlfS50Yi1pbWFnZSAudGItaW1hZ2UtY2FwdGlvbi1maXQtdG8taW1hZ2V7ZGlzcGxheTp0YWJsZX0udGItaW1hZ2UgLnRiLWltYWdlLWNhcHRpb24tZml0LXRvLWltYWdlIC50Yi1pbWFnZS1jYXB0aW9ue2Rpc3BsYXk6dGFibGUtY2FwdGlvbjtjYXB0aW9uLXNpZGU6Ym90dG9tfS50Yi1ncmlkLC50Yi1ncmlkPi5ibG9jay1lZGl0b3ItaW5uZXItYmxvY2tzPi5ibG9jay1lZGl0b3ItYmxvY2stbGlzdF9fbGF5b3V0e2Rpc3BsYXk6Z3JpZDtncmlkLXJvdy1nYXA6MjVweDtncmlkLWNvbHVtbi1nYXA6MjVweH0udGItZ3JpZC1pdGVte2JhY2tncm91bmQ6I2QzOGEwMztwYWRkaW5nOjMwcHh9LnRiLWdyaWQtY29sdW1ue2ZsZXgtd3JhcDp3cmFwfS50Yi1ncmlkLWNvbHVtbj4qe3dpZHRoOjEwMCV9LnRiLWdyaWQtY29sdW1uLnRiLWdyaWQtYWxpZ24tdG9we3dpZHRoOjEwMCU7ZGlzcGxheTpmbGV4O2FsaWduLWNvbnRlbnQ6ZmxleC1zdGFydH0udGItZ3JpZC1jb2x1bW4udGItZ3JpZC1hbGlnbi1jZW50ZXJ7d2lkdGg6MTAwJTtkaXNwbGF5OmZsZXg7YWxpZ24tY29udGVudDpjZW50ZXJ9LnRiLWdyaWQtY29sdW1uLnRiLWdyaWQtYWxpZ24tYm90dG9te3dpZHRoOjEwMCU7ZGlzcGxheTpmbGV4O2FsaWduLWNvbnRlbnQ6ZmxleC1lbmR9IC53cC1ibG9jay10b29sc2V0LWJsb2Nrcy1ncmlkLnRiLWdyaWRbZGF0YS10b29sc2V0LWJsb2Nrcy1ncmlkPSI0YjU1YWRmMWQzMzFmNDk2ZjhhM2I3OWJjNTkwMDczMCJdIHsgZ3JpZC10ZW1wbGF0ZS1jb2x1bW5zOiBtaW5tYXgoMCwgMC41ZnIpIG1pbm1heCgwLCAwLjVmcik7Z3JpZC1hdXRvLWZsb3c6IHJvdyB9IC53cC1ibG9jay10b29sc2V0LWJsb2Nrcy1ncmlkLnRiLWdyaWRbZGF0YS10b29sc2V0LWJsb2Nrcy1ncmlkPSI0YjU1YWRmMWQzMzFmNDk2ZjhhM2I3OWJjNTkwMDczMCJdID4gLnRiLWdyaWQtY29sdW1uOm50aC1vZi10eXBlKDJuICsgMSkgeyBncmlkLWNvbHVtbjogMSB9IC53cC1ibG9jay10b29sc2V0LWJsb2Nrcy1ncmlkLnRiLWdyaWRbZGF0YS10b29sc2V0LWJsb2Nrcy1ncmlkPSI0YjU1YWRmMWQzMzFmNDk2ZjhhM2I3OWJjNTkwMDczMCJdID4gLnRiLWdyaWQtY29sdW1uOm50aC1vZi10eXBlKDJuICsgMikgeyBncmlkLWNvbHVtbjogMiB9IC53cC1ibG9jay10b29sc2V0LWJsb2Nrcy1ncmlkLWNvbHVtbi50Yi1ncmlkLWNvbHVtbltkYXRhLXRvb2xzZXQtYmxvY2tzLWdyaWQtY29sdW1uPSI2ZTA4ZDFmNmQzY2M4MTc0M2JkZDA2Y2I4ZjhjYmUzYiJdIHsgZGlzcGxheTogZmxleDsgfSAudGItY29udGFpbmVyIC50Yi1jb250YWluZXItaW5uZXJ7d2lkdGg6MTAwJTttYXJnaW46MCBhdXRvfSAgLnRiLWltYWdle3Bvc2l0aW9uOnJlbGF0aXZlO3RyYW5zaXRpb246dHJhbnNmb3JtIDAuMjVzIGVhc2V9LndwLWJsb2NrLWltYWdlIC50Yi1pbWFnZS5hbGlnbmNlbnRlcnttYXJnaW4tbGVmdDphdXRvO21hcmdpbi1yaWdodDphdXRvfS50Yi1pbWFnZSBpbWd7bWF4LXdpZHRoOjEwMCU7aGVpZ2h0OmF1dG87d2lkdGg6YXV0bzt0cmFuc2l0aW9uOnRyYW5zZm9ybSAwLjI1cyBlYXNlfS50Yi1pbWFnZSAudGItaW1hZ2UtY2FwdGlvbi1maXQtdG8taW1hZ2V7ZGlzcGxheTp0YWJsZX0udGItaW1hZ2UgLnRiLWltYWdlLWNhcHRpb24tZml0LXRvLWltYWdlIC50Yi1pbWFnZS1jYXB0aW9ue2Rpc3BsYXk6dGFibGUtY2FwdGlvbjtjYXB0aW9uLXNpZGU6Ym90dG9tfS53cC1ibG9jay10b29sc2V0LWJsb2Nrcy1ncmlkLWNvbHVtbi50Yi1ncmlkLWNvbHVtbltkYXRhLXRvb2xzZXQtYmxvY2tzLWdyaWQtY29sdW1uPSIxNGViNTk4YzQ1NzM5MzZjNjFkNDQxNTlkNWVlYTQ0MiJdIHsgZGlzcGxheTogZmxleDsgfSAudGItY29udGFpbmVyIC50Yi1jb250YWluZXItaW5uZXJ7d2lkdGg6MTAwJTttYXJnaW46MCBhdXRvfSAudGItY29udGFpbmVyIC50Yi1jb250YWluZXItaW5uZXJ7d2lkdGg6MTAwJTttYXJnaW46MCBhdXRvfSB9IEBtZWRpYSBvbmx5IHNjcmVlbiBhbmQgKG1heC13aWR0aDogNTk5cHgpIHsgLnRiLWNvbnRhaW5lciAudGItY29udGFpbmVyLWlubmVye3dpZHRoOjEwMCU7bWFyZ2luOjAgYXV0b30udGItY29udGFpbmVyIC50Yi1jb250YWluZXItaW5uZXJ7d2lkdGg6MTAwJTttYXJnaW46MCBhdXRvfSAud3AtYmxvY2stdG9vbHNldC1ibG9ja3MtY29udGFpbmVyLnRiLWNvbnRhaW5lcltkYXRhLXRvb2xzZXQtYmxvY2tzLWNvbnRhaW5lcj0iOTQxZjcxZjZhZjUwOTQyM2YzOWQwYTUzZGU2ODQzMTYiXSB7IHBhZGRpbmctcmlnaHQ6IDE1cHg7cGFkZGluZy1sZWZ0OiAxNXB4OyB9IC50Yi1jb250YWluZXIgLnRiLWNvbnRhaW5lci1pbm5lcnt3aWR0aDoxMDAlO21hcmdpbjowIGF1dG99LnRiLWdyaWQsLnRiLWdyaWQ+LmJsb2NrLWVkaXRvci1pbm5lci1ibG9ja3M+LmJsb2NrLWVkaXRvci1ibG9jay1saXN0X19sYXlvdXR7ZGlzcGxheTpncmlkO2dyaWQtcm93LWdhcDoyNXB4O2dyaWQtY29sdW1uLWdhcDoyNXB4fS50Yi1ncmlkLWl0ZW17YmFja2dyb3VuZDojZDM4YTAzO3BhZGRpbmc6MzBweH0udGItZ3JpZC1jb2x1bW57ZmxleC13cmFwOndyYXB9LnRiLWdyaWQtY29sdW1uPip7d2lkdGg6MTAwJX0udGItZ3JpZC1jb2x1bW4udGItZ3JpZC1hbGlnbi10b3B7d2lkdGg6MTAwJTtkaXNwbGF5OmZsZXg7YWxpZ24tY29udGVudDpmbGV4LXN0YXJ0fS50Yi1ncmlkLWNvbHVtbi50Yi1ncmlkLWFsaWduLWNlbnRlcnt3aWR0aDoxMDAlO2Rpc3BsYXk6ZmxleDthbGlnbi1jb250ZW50OmNlbnRlcn0udGItZ3JpZC1jb2x1bW4udGItZ3JpZC1hbGlnbi1ib3R0b217d2lkdGg6MTAwJTtkaXNwbGF5OmZsZXg7YWxpZ24tY29udGVudDpmbGV4LWVuZH0gLndwLWJsb2NrLXRvb2xzZXQtYmxvY2tzLWdyaWQudGItZ3JpZFtkYXRhLXRvb2xzZXQtYmxvY2tzLWdyaWQ9IjE0ZWM4YWNmYmM2NGFmODg4Njc4OTBkNzhhZjU2OGM5Il0geyBncmlkLXRlbXBsYXRlLWNvbHVtbnM6IG1pbm1heCgwLCAxZnIpO2dyaWQtYXV0by1mbG93OiByb3cgfSAud3AtYmxvY2stdG9vbHNldC1ibG9ja3MtZ3JpZC50Yi1ncmlkW2RhdGEtdG9vbHNldC1ibG9ja3MtZ3JpZD0iMTRlYzhhY2ZiYzY0YWY4ODg2Nzg5MGQ3OGFmNTY4YzkiXSAgPiAudGItZ3JpZC1jb2x1bW46bnRoLW9mLXR5cGUoMW4rMSkgeyBncmlkLWNvbHVtbjogMSB9IC53cC1ibG9jay10b29sc2V0LWJsb2Nrcy1ncmlkLWNvbHVtbi50Yi1ncmlkLWNvbHVtbltkYXRhLXRvb2xzZXQtYmxvY2tzLWdyaWQtY29sdW1uPSIzMDM0ZmJlODg2YzExMDU0ZTk1YjQ2YjA5ZDNlNDExMiJdIHsgZGlzcGxheTogZmxleDsgfSAudGItY29udGFpbmVyIC50Yi1jb250YWluZXItaW5uZXJ7d2lkdGg6MTAwJTttYXJnaW46MCBhdXRvfSAudGItaW1hZ2V7cG9zaXRpb246cmVsYXRpdmU7dHJhbnNpdGlvbjp0cmFuc2Zvcm0gMC4yNXMgZWFzZX0ud3AtYmxvY2staW1hZ2UgLnRiLWltYWdlLmFsaWduY2VudGVye21hcmdpbi1sZWZ0OmF1dG87bWFyZ2luLXJpZ2h0OmF1dG99LnRiLWltYWdlIGltZ3ttYXgtd2lkdGg6MTAwJTtoZWlnaHQ6YXV0bzt3aWR0aDphdXRvO3RyYW5zaXRpb246dHJhbnNmb3JtIDAuMjVzIGVhc2V9LnRiLWltYWdlIC50Yi1pbWFnZS1jYXB0aW9uLWZpdC10by1pbWFnZXtkaXNwbGF5OnRhYmxlfS50Yi1pbWFnZSAudGItaW1hZ2UtY2FwdGlvbi1maXQtdG8taW1hZ2UgLnRiLWltYWdlLWNhcHRpb257ZGlzcGxheTp0YWJsZS1jYXB0aW9uO2NhcHRpb24tc2lkZTpib3R0b219LnRiLWdyaWQsLnRiLWdyaWQ+LmJsb2NrLWVkaXRvci1pbm5lci1ibG9ja3M+LmJsb2NrLWVkaXRvci1ibG9jay1saXN0X19sYXlvdXR7ZGlzcGxheTpncmlkO2dyaWQtcm93LWdhcDoyNXB4O2dyaWQtY29sdW1uLWdhcDoyNXB4fS50Yi1ncmlkLWl0ZW17YmFja2dyb3VuZDojZDM4YTAzO3BhZGRpbmc6MzBweH0udGItZ3JpZC1jb2x1bW57ZmxleC13cmFwOndyYXB9LnRiLWdyaWQtY29sdW1uPip7d2lkdGg6MTAwJX0udGItZ3JpZC1jb2x1bW4udGItZ3JpZC1hbGlnbi10b3B7d2lkdGg6MTAwJTtkaXNwbGF5OmZsZXg7YWxpZ24tY29udGVudDpmbGV4LXN0YXJ0fS50Yi1ncmlkLWNvbHVtbi50Yi1ncmlkLWFsaWduLWNlbnRlcnt3aWR0aDoxMDAlO2Rpc3BsYXk6ZmxleDthbGlnbi1jb250ZW50OmNlbnRlcn0udGItZ3JpZC1jb2x1bW4udGItZ3JpZC1hbGlnbi1ib3R0b217d2lkdGg6MTAwJTtkaXNwbGF5OmZsZXg7YWxpZ24tY29udGVudDpmbGV4LWVuZH0gLndwLWJsb2NrLXRvb2xzZXQtYmxvY2tzLWdyaWQudGItZ3JpZFtkYXRhLXRvb2xzZXQtYmxvY2tzLWdyaWQ9IjRiNTVhZGYxZDMzMWY0OTZmOGEzYjc5YmM1OTAwNzMwIl0geyBncmlkLXRlbXBsYXRlLWNvbHVtbnM6IG1pbm1heCgwLCAxZnIpO2dyaWQtYXV0by1mbG93OiByb3cgfSAud3AtYmxvY2stdG9vbHNldC1ibG9ja3MtZ3JpZC50Yi1ncmlkW2RhdGEtdG9vbHNldC1ibG9ja3MtZ3JpZD0iNGI1NWFkZjFkMzMxZjQ5NmY4YTNiNzliYzU5MDA3MzAiXSAgPiAudGItZ3JpZC1jb2x1bW46bnRoLW9mLXR5cGUoMW4rMSkgeyBncmlkLWNvbHVtbjogMSB9IC53cC1ibG9jay10b29sc2V0LWJsb2Nrcy1ncmlkLWNvbHVtbi50Yi1ncmlkLWNvbHVtbltkYXRhLXRvb2xzZXQtYmxvY2tzLWdyaWQtY29sdW1uPSI2ZTA4ZDFmNmQzY2M4MTc0M2JkZDA2Y2I4ZjhjYmUzYiJdIHsgZGlzcGxheTogZmxleDsgfSAudGItY29udGFpbmVyIC50Yi1jb250YWluZXItaW5uZXJ7d2lkdGg6MTAwJTttYXJnaW46MCBhdXRvfSAgLnRiLWltYWdle3Bvc2l0aW9uOnJlbGF0aXZlO3RyYW5zaXRpb246dHJhbnNmb3JtIDAuMjVzIGVhc2V9LndwLWJsb2NrLWltYWdlIC50Yi1pbWFnZS5hbGlnbmNlbnRlcnttYXJnaW4tbGVmdDphdXRvO21hcmdpbi1yaWdodDphdXRvfS50Yi1pbWFnZSBpbWd7bWF4LXdpZHRoOjEwMCU7aGVpZ2h0OmF1dG87d2lkdGg6YXV0bzt0cmFuc2l0aW9uOnRyYW5zZm9ybSAwLjI1cyBlYXNlfS50Yi1pbWFnZSAudGItaW1hZ2UtY2FwdGlvbi1maXQtdG8taW1hZ2V7ZGlzcGxheTp0YWJsZX0udGItaW1hZ2UgLnRiLWltYWdlLWNhcHRpb24tZml0LXRvLWltYWdlIC50Yi1pbWFnZS1jYXB0aW9ue2Rpc3BsYXk6dGFibGUtY2FwdGlvbjtjYXB0aW9uLXNpZGU6Ym90dG9tfS53cC1ibG9jay10b29sc2V0LWJsb2Nrcy1ncmlkLWNvbHVtbi50Yi1ncmlkLWNvbHVtbltkYXRhLXRvb2xzZXQtYmxvY2tzLWdyaWQtY29sdW1uPSIxNGViNTk4YzQ1NzM5MzZjNjFkNDQxNTlkNWVlYTQ0MiJdIHsgZGlzcGxheTogZmxleDsgfSAudGItZmllbGRzLWFuZC10ZXh0W2RhdGEtdG9vbHNldC1ibG9ja3MtZmllbGRzLWFuZC10ZXh0PSIwNWM3MTJhNWEyMmI1OWRmMWJlNGQyODQ4NzA1ZDMzNSJdIHsgZm9udC1zaXplOiAyNHB4O2xpbmUtaGVpZ2h0OiAzMnB4OyB9IC50Yi1maWVsZHMtYW5kLXRleHRbZGF0YS10b29sc2V0LWJsb2Nrcy1maWVsZHMtYW5kLXRleHQ9IjA1YzcxMmE1YTIyYjU5ZGYxYmU0ZDI4NDg3MDVkMzM1Il0gcCB7IGZvbnQtc2l6ZTogMjRweDtsaW5lLWhlaWdodDogMzJweDsgfSAudGItY29udGFpbmVyIC50Yi1jb250YWluZXItaW5uZXJ7d2lkdGg6MTAwJTttYXJnaW46MCBhdXRvfWgxLnRiLWhlYWRpbmdbZGF0YS10b29sc2V0LWJsb2Nrcy1oZWFkaW5nPSI3ODJkMWZhOGI4NjdjZWUzZTI2OTc4MTdlMTg3MmFkYSJdICB7IGZvbnQtc2l6ZTogNDhweDtsaW5lLWhlaWdodDogNDBweDsgfSAgLnRiLWNvbnRhaW5lciAudGItY29udGFpbmVyLWlubmVye3dpZHRoOjEwMCU7bWFyZ2luOjAgYXV0b30gfSA=
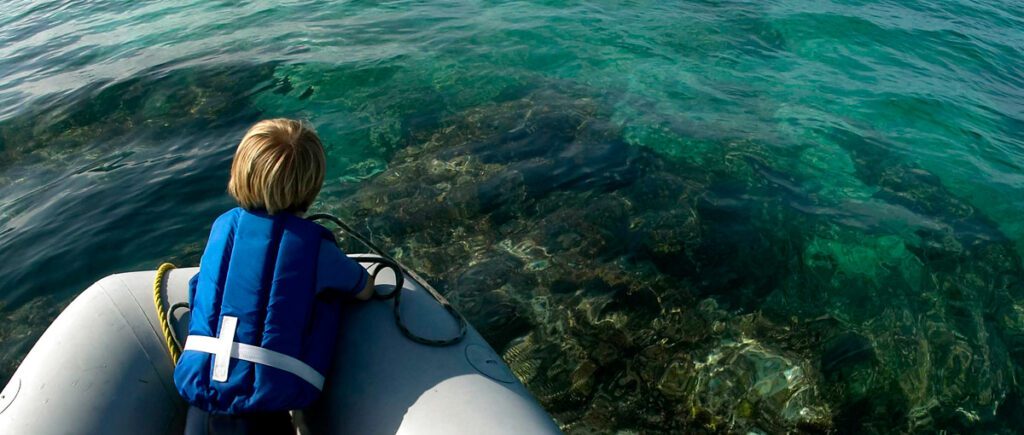
Water… It is impossible to imagine what Earth would be like without it. It is truly amazing that the combination of two hydrogen atoms with one oxygen atom results in this refreshing substance known that is essential to life as we know it!
LnRiLWNvbnRhaW5lciAudGItY29udGFpbmVyLWlubmVye3dpZHRoOjEwMCU7bWFyZ2luOjAgYXV0b30gLndwLWJsb2NrLXRvb2xzZXQtYmxvY2tzLWNvbnRhaW5lci50Yi1jb250YWluZXJbZGF0YS10b29sc2V0LWJsb2Nrcy1jb250YWluZXI9IjUwZWUyMTY1MTllYzRkYWJkNWZkNmIwMGQ2N2Y4MWRmIl0geyBwYWRkaW5nOiAyNXB4IDI1cHggMHB4IDI1cHg7IH0gLndwLWJsb2NrLXRvb2xzZXQtYmxvY2tzLWNvbnRhaW5lci50Yi1jb250YWluZXJbZGF0YS10b29sc2V0LWJsb2Nrcy1jb250YWluZXI9IjUwZWUyMTY1MTllYzRkYWJkNWZkNmIwMGQ2N2Y4MWRmIl0gPiAudGItY29udGFpbmVyLWlubmVyIHsgbWF4LXdpZHRoOiAxMjAwcHg7IH0gLnRiLWNvbnRhaW5lciAudGItY29udGFpbmVyLWlubmVye3dpZHRoOjEwMCU7bWFyZ2luOjAgYXV0b30gLndwLWJsb2NrLXRvb2xzZXQtYmxvY2tzLWNvbnRhaW5lci50Yi1jb250YWluZXJbZGF0YS10b29sc2V0LWJsb2Nrcy1jb250YWluZXI9Ijk0MWY3MWY2YWY1MDk0MjNmMzlkMGE1M2RlNjg0MzE2Il0geyBiYWNrZ3JvdW5kOiByZ2JhKCAyNTUsIDI1NSwgMjU1LCAxICk7cGFkZGluZzogNDVweDttYXJnaW4tdG9wOiAtMTAwcHg7Ym94LXNoYWRvdzogMXB4IC0xcHggMTBweCAwIHJnYmEoIDAsIDAsIDAsIDAuNSApO21pbi1oZWlnaHQ6IDYwMHB4OyB9IC50Yi1jb250YWluZXIgLnRiLWNvbnRhaW5lci1pbm5lcnt3aWR0aDoxMDAlO21hcmdpbjowIGF1dG99IC53cC1ibG9jay10b29sc2V0LWJsb2Nrcy1jb250YWluZXIudGItY29udGFpbmVyW2RhdGEtdG9vbHNldC1ibG9ja3MtY29udGFpbmVyPSIzZmNkODI0ZGMxNzQ0ZjY3NGJhYTExOWUzMGI2ZWUyNSJdIHsgYmFja2dyb3VuZDogcmdiYSggOTMsIDE3MywgMTk2LCAxICk7cGFkZGluZzogMjVweDsgfSAudGItZ3JpZCwudGItZ3JpZD4uYmxvY2stZWRpdG9yLWlubmVyLWJsb2Nrcz4uYmxvY2stZWRpdG9yLWJsb2NrLWxpc3RfX2xheW91dHtkaXNwbGF5OmdyaWQ7Z3JpZC1yb3ctZ2FwOjI1cHg7Z3JpZC1jb2x1bW4tZ2FwOjI1cHh9LnRiLWdyaWQtaXRlbXtiYWNrZ3JvdW5kOiNkMzhhMDM7cGFkZGluZzozMHB4fS50Yi1ncmlkLWNvbHVtbntmbGV4LXdyYXA6d3JhcH0udGItZ3JpZC1jb2x1bW4+Knt3aWR0aDoxMDAlfS50Yi1ncmlkLWNvbHVtbi50Yi1ncmlkLWFsaWduLXRvcHt3aWR0aDoxMDAlO2Rpc3BsYXk6ZmxleDthbGlnbi1jb250ZW50OmZsZXgtc3RhcnR9LnRiLWdyaWQtY29sdW1uLnRiLWdyaWQtYWxpZ24tY2VudGVye3dpZHRoOjEwMCU7ZGlzcGxheTpmbGV4O2FsaWduLWNvbnRlbnQ6Y2VudGVyfS50Yi1ncmlkLWNvbHVtbi50Yi1ncmlkLWFsaWduLWJvdHRvbXt3aWR0aDoxMDAlO2Rpc3BsYXk6ZmxleDthbGlnbi1jb250ZW50OmZsZXgtZW5kfSAud3AtYmxvY2stdG9vbHNldC1ibG9ja3MtZ3JpZC50Yi1ncmlkW2RhdGEtdG9vbHNldC1ibG9ja3MtZ3JpZD0iMTRlYzhhY2ZiYzY0YWY4ODg2Nzg5MGQ3OGFmNTY4YzkiXSB7IGdyaWQtdGVtcGxhdGUtY29sdW1uczogbWlubWF4KDAsIDAuMzM1ZnIpIG1pbm1heCgwLCAwLjY2NWZyKTtncmlkLWF1dG8tZmxvdzogcm93IH0gLndwLWJsb2NrLXRvb2xzZXQtYmxvY2tzLWdyaWQudGItZ3JpZFtkYXRhLXRvb2xzZXQtYmxvY2tzLWdyaWQ9IjE0ZWM4YWNmYmM2NGFmODg4Njc4OTBkNzhhZjU2OGM5Il0gPiAudGItZ3JpZC1jb2x1bW46bnRoLW9mLXR5cGUoMm4gKyAxKSB7IGdyaWQtY29sdW1uOiAxIH0gLndwLWJsb2NrLXRvb2xzZXQtYmxvY2tzLWdyaWQudGItZ3JpZFtkYXRhLXRvb2xzZXQtYmxvY2tzLWdyaWQ9IjE0ZWM4YWNmYmM2NGFmODg4Njc4OTBkNzhhZjU2OGM5Il0gPiAudGItZ3JpZC1jb2x1bW46bnRoLW9mLXR5cGUoMm4gKyAyKSB7IGdyaWQtY29sdW1uOiAyIH0gLnRiLWZpZWxkcy1hbmQtdGV4dFtkYXRhLXRvb2xzZXQtYmxvY2tzLWZpZWxkcy1hbmQtdGV4dD0iNDY3MDMzZjZmOWI1YTMwZDdhMGJlYzdjYjJiMzgyYTUiXSB7IGZvbnQtc2l6ZTogMTZweDtsaW5lLWhlaWdodDogNDBweDtjb2xvcjogcmdiYSggMjU1LCAyNTUsIDI1NSwgMSApO21hcmdpbi10b3A6IDQwcHg7IH0gLnRiLWZpZWxkcy1hbmQtdGV4dFtkYXRhLXRvb2xzZXQtYmxvY2tzLWZpZWxkcy1hbmQtdGV4dD0iNDY3MDMzZjZmOWI1YTMwZDdhMGJlYzdjYjJiMzgyYTUiXSBwIHsgZm9udC1zaXplOiAxNnB4O2xpbmUtaGVpZ2h0OiA0MHB4O2NvbG9yOiByZ2JhKCAyNTUsIDI1NSwgMjU1LCAxICk7IH0gLndwLWJsb2NrLXRvb2xzZXQtYmxvY2tzLWdyaWQtY29sdW1uLnRiLWdyaWQtY29sdW1uW2RhdGEtdG9vbHNldC1ibG9ja3MtZ3JpZC1jb2x1bW49IjMwMzRmYmU4ODZjMTEwNTRlOTViNDZiMDlkM2U0MTEyIl0geyBkaXNwbGF5OiBmbGV4OyB9IC50Yi1jb250YWluZXIgLnRiLWNvbnRhaW5lci1pbm5lcnt3aWR0aDoxMDAlO21hcmdpbjowIGF1dG99IC53cC1ibG9jay10b29sc2V0LWJsb2Nrcy1jb250YWluZXIudGItY29udGFpbmVyW2RhdGEtdG9vbHNldC1ibG9ja3MtY29udGFpbmVyPSJlZDM4MzJhYTYyMDFjYmVjNWIxZTViOTAyZGMwNjdlMiJdIHsgcGFkZGluZzogMjVweDsgfSAudGItaGVhZGluZ1tkYXRhLXRvb2xzZXQtYmxvY2tzLWhlYWRpbmc9ImU3NmFkMWRiZWY2ZTEzNmJjZDcyMGIxYTM1ZjFlZGIzIl0gIHsgZm9udC1zaXplOiAyMHB4O2NvbG9yOiByZ2JhKCAyNTUsIDI1NSwgMjU1LCAxICk7bWFyZ2luLXRvcDogMTVweDsgfSAgLnRiLWltYWdle3Bvc2l0aW9uOnJlbGF0aXZlO3RyYW5zaXRpb246dHJhbnNmb3JtIDAuMjVzIGVhc2V9LndwLWJsb2NrLWltYWdlIC50Yi1pbWFnZS5hbGlnbmNlbnRlcnttYXJnaW4tbGVmdDphdXRvO21hcmdpbi1yaWdodDphdXRvfS50Yi1pbWFnZSBpbWd7bWF4LXdpZHRoOjEwMCU7aGVpZ2h0OmF1dG87d2lkdGg6YXV0bzt0cmFuc2l0aW9uOnRyYW5zZm9ybSAwLjI1cyBlYXNlfS50Yi1pbWFnZSAudGItaW1hZ2UtY2FwdGlvbi1maXQtdG8taW1hZ2V7ZGlzcGxheTp0YWJsZX0udGItaW1hZ2UgLnRiLWltYWdlLWNhcHRpb24tZml0LXRvLWltYWdlIC50Yi1pbWFnZS1jYXB0aW9ue2Rpc3BsYXk6dGFibGUtY2FwdGlvbjtjYXB0aW9uLXNpZGU6Ym90dG9tfSAud3AtYmxvY2staW1hZ2UudGItaW1hZ2VbZGF0YS10b29sc2V0LWJsb2Nrcy1pbWFnZT0iNzRkZWZlMmM0NDRlMWEwMWQ1MjY2YjJiMjZjZmVkZDMiXSB7IG1heC13aWR0aDogMTAwJTsgfSAudGItZ3JpZCwudGItZ3JpZD4uYmxvY2stZWRpdG9yLWlubmVyLWJsb2Nrcz4uYmxvY2stZWRpdG9yLWJsb2NrLWxpc3RfX2xheW91dHtkaXNwbGF5OmdyaWQ7Z3JpZC1yb3ctZ2FwOjI1cHg7Z3JpZC1jb2x1bW4tZ2FwOjI1cHh9LnRiLWdyaWQtaXRlbXtiYWNrZ3JvdW5kOiNkMzhhMDM7cGFkZGluZzozMHB4fS50Yi1ncmlkLWNvbHVtbntmbGV4LXdyYXA6d3JhcH0udGItZ3JpZC1jb2x1bW4+Knt3aWR0aDoxMDAlfS50Yi1ncmlkLWNvbHVtbi50Yi1ncmlkLWFsaWduLXRvcHt3aWR0aDoxMDAlO2Rpc3BsYXk6ZmxleDthbGlnbi1jb250ZW50OmZsZXgtc3RhcnR9LnRiLWdyaWQtY29sdW1uLnRiLWdyaWQtYWxpZ24tY2VudGVye3dpZHRoOjEwMCU7ZGlzcGxheTpmbGV4O2FsaWduLWNvbnRlbnQ6Y2VudGVyfS50Yi1ncmlkLWNvbHVtbi50Yi1ncmlkLWFsaWduLWJvdHRvbXt3aWR0aDoxMDAlO2Rpc3BsYXk6ZmxleDthbGlnbi1jb250ZW50OmZsZXgtZW5kfSAud3AtYmxvY2stdG9vbHNldC1ibG9ja3MtZ3JpZC50Yi1ncmlkW2RhdGEtdG9vbHNldC1ibG9ja3MtZ3JpZD0iNGI1NWFkZjFkMzMxZjQ5NmY4YTNiNzliYzU5MDA3MzAiXSB7IGdyaWQtdGVtcGxhdGUtY29sdW1uczogbWlubWF4KDAsIDAuODA1ZnIpIG1pbm1heCgwLCAwLjE5NWZyKTtncmlkLWF1dG8tZmxvdzogcm93IH0gLndwLWJsb2NrLXRvb2xzZXQtYmxvY2tzLWdyaWQudGItZ3JpZFtkYXRhLXRvb2xzZXQtYmxvY2tzLWdyaWQ9IjRiNTVhZGYxZDMzMWY0OTZmOGEzYjc5YmM1OTAwNzMwIl0gPiAudGItZ3JpZC1jb2x1bW46bnRoLW9mLXR5cGUoMm4gKyAxKSB7IGdyaWQtY29sdW1uOiAxIH0gLndwLWJsb2NrLXRvb2xzZXQtYmxvY2tzLWdyaWQudGItZ3JpZFtkYXRhLXRvb2xzZXQtYmxvY2tzLWdyaWQ9IjRiNTVhZGYxZDMzMWY0OTZmOGEzYjc5YmM1OTAwNzMwIl0gPiAudGItZ3JpZC1jb2x1bW46bnRoLW9mLXR5cGUoMm4gKyAyKSB7IGdyaWQtY29sdW1uOiAyIH0gLndwLWJsb2NrLXRvb2xzZXQtYmxvY2tzLWdyaWQtY29sdW1uLnRiLWdyaWQtY29sdW1uW2RhdGEtdG9vbHNldC1ibG9ja3MtZ3JpZC1jb2x1bW49IjZlMDhkMWY2ZDNjYzgxNzQzYmRkMDZjYjhmOGNiZTNiIl0geyBwYWRkaW5nLXRvcDogMjVweDtkaXNwbGF5OiBmbGV4OyB9IC50Yi1jb250YWluZXIgLnRiLWNvbnRhaW5lci1pbm5lcnt3aWR0aDoxMDAlO21hcmdpbjowIGF1dG99IC53cC1ibG9jay10b29sc2V0LWJsb2Nrcy1jb250YWluZXIudGItY29udGFpbmVyW2RhdGEtdG9vbHNldC1ibG9ja3MtY29udGFpbmVyPSI3NmI5ZTE5YWViZDc4YjQ2N2IwNGM2NGFjZmUzMzE2NyJdIHsgcGFkZGluZzogMHB4OyB9IGgyLnRiLWhlYWRpbmdbZGF0YS10b29sc2V0LWJsb2Nrcy1oZWFkaW5nPSI0YzllYTlkNDYyZGI0MWZhOThhYzNjN2U1MTNhYjhmNiJdICB7IGZvbnQtc2l6ZTogMTZweDt0ZXh0LWRlY29yYXRpb246IG5vbmU7IH0gIGgyLnRiLWhlYWRpbmdbZGF0YS10b29sc2V0LWJsb2Nrcy1oZWFkaW5nPSJjOWZhZDk4NmFmMGQ0M2IwNTFhN2EzZGNlYWQyNjk0MSJdICB7IGZvbnQtc2l6ZTogMThweDtjb2xvcjogcmdiYSggMzQsIDg0LCAxMTgsIDEgKTt0ZXh0LWFsaWduOiBjZW50ZXI7bWFyZ2luLXRvcDogMTBweDsgfSAgLnRiLWltYWdle3Bvc2l0aW9uOnJlbGF0aXZlO3RyYW5zaXRpb246dHJhbnNmb3JtIDAuMjVzIGVhc2V9LndwLWJsb2NrLWltYWdlIC50Yi1pbWFnZS5hbGlnbmNlbnRlcnttYXJnaW4tbGVmdDphdXRvO21hcmdpbi1yaWdodDphdXRvfS50Yi1pbWFnZSBpbWd7bWF4LXdpZHRoOjEwMCU7aGVpZ2h0OmF1dG87d2lkdGg6YXV0bzt0cmFuc2l0aW9uOnRyYW5zZm9ybSAwLjI1cyBlYXNlfS50Yi1pbWFnZSAudGItaW1hZ2UtY2FwdGlvbi1maXQtdG8taW1hZ2V7ZGlzcGxheTp0YWJsZX0udGItaW1hZ2UgLnRiLWltYWdlLWNhcHRpb24tZml0LXRvLWltYWdlIC50Yi1pbWFnZS1jYXB0aW9ue2Rpc3BsYXk6dGFibGUtY2FwdGlvbjtjYXB0aW9uLXNpZGU6Ym90dG9tfSAud3AtYmxvY2staW1hZ2UudGItaW1hZ2VbZGF0YS10b29sc2V0LWJsb2Nrcy1pbWFnZT0iM2RhYWViMzdjMGZmYjA3MDVjNGViMWVkNTBlOGQ5MzUiXSB7IG1heC13aWR0aDogMTAwJTsgfSAud3AtYmxvY2stdG9vbHNldC1ibG9ja3MtZ3JpZC1jb2x1bW4udGItZ3JpZC1jb2x1bW5bZGF0YS10b29sc2V0LWJsb2Nrcy1ncmlkLWNvbHVtbj0iMTRlYjU5OGM0NTczOTM2YzYxZDQ0MTU5ZDVlZWE0NDIiXSB7IGRpc3BsYXk6IGZsZXg7IH0gLnRiLWZpZWxkcy1hbmQtdGV4dFtkYXRhLXRvb2xzZXQtYmxvY2tzLWZpZWxkcy1hbmQtdGV4dD0iMDVjNzEyYTVhMjJiNTlkZjFiZTRkMjg0ODcwNWQzMzUiXSB7IGZvbnQtc2l6ZTogMjRweDtsaW5lLWhlaWdodDogNDBweDtjb2xvcjogcmdiYSggMzQsIDg0LCAxMTgsIDEgKTsgfSAudGItZmllbGRzLWFuZC10ZXh0W2RhdGEtdG9vbHNldC1ibG9ja3MtZmllbGRzLWFuZC10ZXh0PSIwNWM3MTJhNWEyMmI1OWRmMWJlNGQyODQ4NzA1ZDMzNSJdIHAgeyBmb250LXNpemU6IDI0cHg7bGluZS1oZWlnaHQ6IDQwcHg7Y29sb3I6IHJnYmEoIDM0LCA4NCwgMTE4LCAxICk7IH0gLnRiLWNvbnRhaW5lciAudGItY29udGFpbmVyLWlubmVye3dpZHRoOjEwMCU7bWFyZ2luOjAgYXV0b30gLndwLWJsb2NrLXRvb2xzZXQtYmxvY2tzLWNvbnRhaW5lci50Yi1jb250YWluZXJbZGF0YS10b29sc2V0LWJsb2Nrcy1jb250YWluZXI9ImEyMWI5OTg4MDg3MjNjOGFiMzU4MWNkMzIwM2ZiYmUzIl0geyBiYWNrZ3JvdW5kOmxpbmVhci1ncmFkaWVudChyZ2JhKCAwLCAwLCAwLCAwLjMyICkscmdiYSggMCwgMCwgMCwgMC4zMiApKSwgIHJnYmEoIDI1NSwgMjU1LCAyNTUsIDAgKSB1cmwoJycpIGNlbnRlciBjZW50ZXIgbm8tcmVwZWF0O2JhY2tncm91bmQtc2l6ZTphdXRvLCBjb3ZlcjtwYWRkaW5nOiAyNXB4O21hcmdpbi10b3A6IC01MDBweDttaW4taGVpZ2h0OiA1MDBweDtkaXNwbGF5Om1zLWZsZXhib3ggIWltcG9ydGFudDtkaXNwbGF5OmZsZXggIWltcG9ydGFudDstbXMtZmxleC1kaXJlY3Rpb246Y29sdW1uO2ZsZXgtZGlyZWN0aW9uOmNvbHVtbjstbXMtZmxleC1wYWNrOmNlbnRlcjtqdXN0aWZ5LWNvbnRlbnQ6Y2VudGVyOyB9IC53cC1ibG9jay10b29sc2V0LWJsb2Nrcy1jb250YWluZXIudGItY29udGFpbmVyW2RhdGEtdG9vbHNldC1ibG9ja3MtY29udGFpbmVyPSJhMjFiOTk4ODA4NzIzYzhhYjM1ODFjZDMyMDNmYmJlMyJdID4gLnRiLWNvbnRhaW5lci1pbm5lciB7IG1heC13aWR0aDogMTIwMHB4OyB9IC53cC1ibG9jay10b29sc2V0LWJsb2Nrcy1jb250YWluZXIudGItY29udGFpbmVyW2RhdGEtdG9vbHNldC1ibG9ja3MtY29udGFpbmVyPSJhMjFiOTk4ODA4NzIzYzhhYjM1ODFjZDMyMDNmYmJlMyJdIHAgeyBsZXR0ZXItc3BhY2luZzogMHB4OyB9IC50Yi1maWVsZHMtYW5kLXRleHRbZGF0YS10b29sc2V0LWJsb2Nrcy1maWVsZHMtYW5kLXRleHQ9ImVkMzgwMWMyMjk1ZDQ1N2E0MTg3NzdjMzgyNGRmMWIzIl0geyBmb250LXNpemU6IDIwcHg7Y29sb3I6IHJnYmEoIDI1NSwgMjU1LCAyNTUsIDEgKTsgfSAudGItZmllbGRzLWFuZC10ZXh0W2RhdGEtdG9vbHNldC1ibG9ja3MtZmllbGRzLWFuZC10ZXh0PSJlZDM4MDFjMjI5NWQ0NTdhNDE4Nzc3YzM4MjRkZjFiMyJdIHAgeyBmb250LXNpemU6IDIwcHg7Y29sb3I6IHJnYmEoIDI1NSwgMjU1LCAyNTUsIDEgKTsgfSBoMS50Yi1oZWFkaW5nW2RhdGEtdG9vbHNldC1ibG9ja3MtaGVhZGluZz0iNzgyZDFmYThiODY3Y2VlM2UyNjk3ODE3ZTE4NzJhZGEiXSAgeyBmb250LXNpemU6IDY0cHg7bGluZS1oZWlnaHQ6IDUycHg7bGV0dGVyLXNwYWNpbmc6IDBweDt0ZXh0LXRyYW5zZm9ybTogdXBwZXJjYXNlO2NvbG9yOiByZ2JhKCAyNTUsIDI1NSwgMjU1LCAxICk7dGV4dC1hbGlnbjogY2VudGVyO3BhZGRpbmctdG9wOiAwcHg7cGFkZGluZy1ib3R0b206IDBweDttYXJnaW4tdG9wOiA3NXB4O21hcmdpbi1ib3R0b206IDBweDsgfSAgLnRiLWNvbnRhaW5lciAudGItY29udGFpbmVyLWlubmVye3dpZHRoOjEwMCU7bWFyZ2luOjAgYXV0b30gLndwLWJsb2NrLXRvb2xzZXQtYmxvY2tzLWNvbnRhaW5lci50Yi1jb250YWluZXJbZGF0YS10b29sc2V0LWJsb2Nrcy1jb250YWluZXI9IjM2NjdlNzYzMWM0MjhjNzA0YjI5NjdiZGJhNzAxYTJiIl0geyBiYWNrZ3JvdW5kOmxpbmVhci1ncmFkaWVudChyZ2JhKCAyNTUsIDI1NSwgMjU1LCAwICkscmdiYSggMjU1LCAyNTUsIDI1NSwgMCApKSwgIHJnYmEoIDAsIDAsIDAsIDEgKSB1cmwoJycpIGNlbnRlciB0b3Agbm8tcmVwZWF0O2JhY2tncm91bmQtc2l6ZTphdXRvLCBjb3ZlcjtwYWRkaW5nOiAwcHg7bWFyZ2luOiAwcHg7bWluLWhlaWdodDogNTAwcHg7IH0gQG1lZGlhIG9ubHkgc2NyZWVuIGFuZCAobWF4LXdpZHRoOiA3ODFweCkgeyAudGItY29udGFpbmVyIC50Yi1jb250YWluZXItaW5uZXJ7d2lkdGg6MTAwJTttYXJnaW46MCBhdXRvfS50Yi1jb250YWluZXIgLnRiLWNvbnRhaW5lci1pbm5lcnt3aWR0aDoxMDAlO21hcmdpbjowIGF1dG99LnRiLWNvbnRhaW5lciAudGItY29udGFpbmVyLWlubmVye3dpZHRoOjEwMCU7bWFyZ2luOjAgYXV0b30udGItZ3JpZCwudGItZ3JpZD4uYmxvY2stZWRpdG9yLWlubmVyLWJsb2Nrcz4uYmxvY2stZWRpdG9yLWJsb2NrLWxpc3RfX2xheW91dHtkaXNwbGF5OmdyaWQ7Z3JpZC1yb3ctZ2FwOjI1cHg7Z3JpZC1jb2x1bW4tZ2FwOjI1cHh9LnRiLWdyaWQtaXRlbXtiYWNrZ3JvdW5kOiNkMzhhMDM7cGFkZGluZzozMHB4fS50Yi1ncmlkLWNvbHVtbntmbGV4LXdyYXA6d3JhcH0udGItZ3JpZC1jb2x1bW4+Knt3aWR0aDoxMDAlfS50Yi1ncmlkLWNvbHVtbi50Yi1ncmlkLWFsaWduLXRvcHt3aWR0aDoxMDAlO2Rpc3BsYXk6ZmxleDthbGlnbi1jb250ZW50OmZsZXgtc3RhcnR9LnRiLWdyaWQtY29sdW1uLnRiLWdyaWQtYWxpZ24tY2VudGVye3dpZHRoOjEwMCU7ZGlzcGxheTpmbGV4O2FsaWduLWNvbnRlbnQ6Y2VudGVyfS50Yi1ncmlkLWNvbHVtbi50Yi1ncmlkLWFsaWduLWJvdHRvbXt3aWR0aDoxMDAlO2Rpc3BsYXk6ZmxleDthbGlnbi1jb250ZW50OmZsZXgtZW5kfSAud3AtYmxvY2stdG9vbHNldC1ibG9ja3MtZ3JpZC50Yi1ncmlkW2RhdGEtdG9vbHNldC1ibG9ja3MtZ3JpZD0iMTRlYzhhY2ZiYzY0YWY4ODg2Nzg5MGQ3OGFmNTY4YzkiXSB7IGdyaWQtdGVtcGxhdGUtY29sdW1uczogbWlubWF4KDAsIDAuNWZyKSBtaW5tYXgoMCwgMC41ZnIpO2dyaWQtYXV0by1mbG93OiByb3cgfSAud3AtYmxvY2stdG9vbHNldC1ibG9ja3MtZ3JpZC50Yi1ncmlkW2RhdGEtdG9vbHNldC1ibG9ja3MtZ3JpZD0iMTRlYzhhY2ZiYzY0YWY4ODg2Nzg5MGQ3OGFmNTY4YzkiXSA+IC50Yi1ncmlkLWNvbHVtbjpudGgtb2YtdHlwZSgybiArIDEpIHsgZ3JpZC1jb2x1bW46IDEgfSAud3AtYmxvY2stdG9vbHNldC1ibG9ja3MtZ3JpZC50Yi1ncmlkW2RhdGEtdG9vbHNldC1ibG9ja3MtZ3JpZD0iMTRlYzhhY2ZiYzY0YWY4ODg2Nzg5MGQ3OGFmNTY4YzkiXSA+IC50Yi1ncmlkLWNvbHVtbjpudGgtb2YtdHlwZSgybiArIDIpIHsgZ3JpZC1jb2x1bW46IDIgfSAud3AtYmxvY2stdG9vbHNldC1ibG9ja3MtZ3JpZC1jb2x1bW4udGItZ3JpZC1jb2x1bW5bZGF0YS10b29sc2V0LWJsb2Nrcy1ncmlkLWNvbHVtbj0iMzAzNGZiZTg4NmMxMTA1NGU5NWI0NmIwOWQzZTQxMTIiXSB7IGRpc3BsYXk6IGZsZXg7IH0gLnRiLWNvbnRhaW5lciAudGItY29udGFpbmVyLWlubmVye3dpZHRoOjEwMCU7bWFyZ2luOjAgYXV0b30gLnRiLWltYWdle3Bvc2l0aW9uOnJlbGF0aXZlO3RyYW5zaXRpb246dHJhbnNmb3JtIDAuMjVzIGVhc2V9LndwLWJsb2NrLWltYWdlIC50Yi1pbWFnZS5hbGlnbmNlbnRlcnttYXJnaW4tbGVmdDphdXRvO21hcmdpbi1yaWdodDphdXRvfS50Yi1pbWFnZSBpbWd7bWF4LXdpZHRoOjEwMCU7aGVpZ2h0OmF1dG87d2lkdGg6YXV0bzt0cmFuc2l0aW9uOnRyYW5zZm9ybSAwLjI1cyBlYXNlfS50Yi1pbWFnZSAudGItaW1hZ2UtY2FwdGlvbi1maXQtdG8taW1hZ2V7ZGlzcGxheTp0YWJsZX0udGItaW1hZ2UgLnRiLWltYWdlLWNhcHRpb24tZml0LXRvLWltYWdlIC50Yi1pbWFnZS1jYXB0aW9ue2Rpc3BsYXk6dGFibGUtY2FwdGlvbjtjYXB0aW9uLXNpZGU6Ym90dG9tfS50Yi1ncmlkLC50Yi1ncmlkPi5ibG9jay1lZGl0b3ItaW5uZXItYmxvY2tzPi5ibG9jay1lZGl0b3ItYmxvY2stbGlzdF9fbGF5b3V0e2Rpc3BsYXk6Z3JpZDtncmlkLXJvdy1nYXA6MjVweDtncmlkLWNvbHVtbi1nYXA6MjVweH0udGItZ3JpZC1pdGVte2JhY2tncm91bmQ6I2QzOGEwMztwYWRkaW5nOjMwcHh9LnRiLWdyaWQtY29sdW1ue2ZsZXgtd3JhcDp3cmFwfS50Yi1ncmlkLWNvbHVtbj4qe3dpZHRoOjEwMCV9LnRiLWdyaWQtY29sdW1uLnRiLWdyaWQtYWxpZ24tdG9we3dpZHRoOjEwMCU7ZGlzcGxheTpmbGV4O2FsaWduLWNvbnRlbnQ6ZmxleC1zdGFydH0udGItZ3JpZC1jb2x1bW4udGItZ3JpZC1hbGlnbi1jZW50ZXJ7d2lkdGg6MTAwJTtkaXNwbGF5OmZsZXg7YWxpZ24tY29udGVudDpjZW50ZXJ9LnRiLWdyaWQtY29sdW1uLnRiLWdyaWQtYWxpZ24tYm90dG9te3dpZHRoOjEwMCU7ZGlzcGxheTpmbGV4O2FsaWduLWNvbnRlbnQ6ZmxleC1lbmR9IC53cC1ibG9jay10b29sc2V0LWJsb2Nrcy1ncmlkLnRiLWdyaWRbZGF0YS10b29sc2V0LWJsb2Nrcy1ncmlkPSI0YjU1YWRmMWQzMzFmNDk2ZjhhM2I3OWJjNTkwMDczMCJdIHsgZ3JpZC10ZW1wbGF0ZS1jb2x1bW5zOiBtaW5tYXgoMCwgMC41ZnIpIG1pbm1heCgwLCAwLjVmcik7Z3JpZC1hdXRvLWZsb3c6IHJvdyB9IC53cC1ibG9jay10b29sc2V0LWJsb2Nrcy1ncmlkLnRiLWdyaWRbZGF0YS10b29sc2V0LWJsb2Nrcy1ncmlkPSI0YjU1YWRmMWQzMzFmNDk2ZjhhM2I3OWJjNTkwMDczMCJdID4gLnRiLWdyaWQtY29sdW1uOm50aC1vZi10eXBlKDJuICsgMSkgeyBncmlkLWNvbHVtbjogMSB9IC53cC1ibG9jay10b29sc2V0LWJsb2Nrcy1ncmlkLnRiLWdyaWRbZGF0YS10b29sc2V0LWJsb2Nrcy1ncmlkPSI0YjU1YWRmMWQzMzFmNDk2ZjhhM2I3OWJjNTkwMDczMCJdID4gLnRiLWdyaWQtY29sdW1uOm50aC1vZi10eXBlKDJuICsgMikgeyBncmlkLWNvbHVtbjogMiB9IC53cC1ibG9jay10b29sc2V0LWJsb2Nrcy1ncmlkLWNvbHVtbi50Yi1ncmlkLWNvbHVtbltkYXRhLXRvb2xzZXQtYmxvY2tzLWdyaWQtY29sdW1uPSI2ZTA4ZDFmNmQzY2M4MTc0M2JkZDA2Y2I4ZjhjYmUzYiJdIHsgZGlzcGxheTogZmxleDsgfSAudGItY29udGFpbmVyIC50Yi1jb250YWluZXItaW5uZXJ7d2lkdGg6MTAwJTttYXJnaW46MCBhdXRvfSAgLnRiLWltYWdle3Bvc2l0aW9uOnJlbGF0aXZlO3RyYW5zaXRpb246dHJhbnNmb3JtIDAuMjVzIGVhc2V9LndwLWJsb2NrLWltYWdlIC50Yi1pbWFnZS5hbGlnbmNlbnRlcnttYXJnaW4tbGVmdDphdXRvO21hcmdpbi1yaWdodDphdXRvfS50Yi1pbWFnZSBpbWd7bWF4LXdpZHRoOjEwMCU7aGVpZ2h0OmF1dG87d2lkdGg6YXV0bzt0cmFuc2l0aW9uOnRyYW5zZm9ybSAwLjI1cyBlYXNlfS50Yi1pbWFnZSAudGItaW1hZ2UtY2FwdGlvbi1maXQtdG8taW1hZ2V7ZGlzcGxheTp0YWJsZX0udGItaW1hZ2UgLnRiLWltYWdlLWNhcHRpb24tZml0LXRvLWltYWdlIC50Yi1pbWFnZS1jYXB0aW9ue2Rpc3BsYXk6dGFibGUtY2FwdGlvbjtjYXB0aW9uLXNpZGU6Ym90dG9tfS53cC1ibG9jay10b29sc2V0LWJsb2Nrcy1ncmlkLWNvbHVtbi50Yi1ncmlkLWNvbHVtbltkYXRhLXRvb2xzZXQtYmxvY2tzLWdyaWQtY29sdW1uPSIxNGViNTk4YzQ1NzM5MzZjNjFkNDQxNTlkNWVlYTQ0MiJdIHsgZGlzcGxheTogZmxleDsgfSAudGItY29udGFpbmVyIC50Yi1jb250YWluZXItaW5uZXJ7d2lkdGg6MTAwJTttYXJnaW46MCBhdXRvfSAudGItY29udGFpbmVyIC50Yi1jb250YWluZXItaW5uZXJ7d2lkdGg6MTAwJTttYXJnaW46MCBhdXRvfSB9IEBtZWRpYSBvbmx5IHNjcmVlbiBhbmQgKG1heC13aWR0aDogNTk5cHgpIHsgLnRiLWNvbnRhaW5lciAudGItY29udGFpbmVyLWlubmVye3dpZHRoOjEwMCU7bWFyZ2luOjAgYXV0b30udGItY29udGFpbmVyIC50Yi1jb250YWluZXItaW5uZXJ7d2lkdGg6MTAwJTttYXJnaW46MCBhdXRvfSAud3AtYmxvY2stdG9vbHNldC1ibG9ja3MtY29udGFpbmVyLnRiLWNvbnRhaW5lcltkYXRhLXRvb2xzZXQtYmxvY2tzLWNvbnRhaW5lcj0iOTQxZjcxZjZhZjUwOTQyM2YzOWQwYTUzZGU2ODQzMTYiXSB7IHBhZGRpbmctcmlnaHQ6IDE1cHg7cGFkZGluZy1sZWZ0OiAxNXB4OyB9IC50Yi1jb250YWluZXIgLnRiLWNvbnRhaW5lci1pbm5lcnt3aWR0aDoxMDAlO21hcmdpbjowIGF1dG99LnRiLWdyaWQsLnRiLWdyaWQ+LmJsb2NrLWVkaXRvci1pbm5lci1ibG9ja3M+LmJsb2NrLWVkaXRvci1ibG9jay1saXN0X19sYXlvdXR7ZGlzcGxheTpncmlkO2dyaWQtcm93LWdhcDoyNXB4O2dyaWQtY29sdW1uLWdhcDoyNXB4fS50Yi1ncmlkLWl0ZW17YmFja2dyb3VuZDojZDM4YTAzO3BhZGRpbmc6MzBweH0udGItZ3JpZC1jb2x1bW57ZmxleC13cmFwOndyYXB9LnRiLWdyaWQtY29sdW1uPip7d2lkdGg6MTAwJX0udGItZ3JpZC1jb2x1bW4udGItZ3JpZC1hbGlnbi10b3B7d2lkdGg6MTAwJTtkaXNwbGF5OmZsZXg7YWxpZ24tY29udGVudDpmbGV4LXN0YXJ0fS50Yi1ncmlkLWNvbHVtbi50Yi1ncmlkLWFsaWduLWNlbnRlcnt3aWR0aDoxMDAlO2Rpc3BsYXk6ZmxleDthbGlnbi1jb250ZW50OmNlbnRlcn0udGItZ3JpZC1jb2x1bW4udGItZ3JpZC1hbGlnbi1ib3R0b217d2lkdGg6MTAwJTtkaXNwbGF5OmZsZXg7YWxpZ24tY29udGVudDpmbGV4LWVuZH0gLndwLWJsb2NrLXRvb2xzZXQtYmxvY2tzLWdyaWQudGItZ3JpZFtkYXRhLXRvb2xzZXQtYmxvY2tzLWdyaWQ9IjE0ZWM4YWNmYmM2NGFmODg4Njc4OTBkNzhhZjU2OGM5Il0geyBncmlkLXRlbXBsYXRlLWNvbHVtbnM6IG1pbm1heCgwLCAxZnIpO2dyaWQtYXV0by1mbG93OiByb3cgfSAud3AtYmxvY2stdG9vbHNldC1ibG9ja3MtZ3JpZC50Yi1ncmlkW2RhdGEtdG9vbHNldC1ibG9ja3MtZ3JpZD0iMTRlYzhhY2ZiYzY0YWY4ODg2Nzg5MGQ3OGFmNTY4YzkiXSAgPiAudGItZ3JpZC1jb2x1bW46bnRoLW9mLXR5cGUoMW4rMSkgeyBncmlkLWNvbHVtbjogMSB9IC53cC1ibG9jay10b29sc2V0LWJsb2Nrcy1ncmlkLWNvbHVtbi50Yi1ncmlkLWNvbHVtbltkYXRhLXRvb2xzZXQtYmxvY2tzLWdyaWQtY29sdW1uPSIzMDM0ZmJlODg2YzExMDU0ZTk1YjQ2YjA5ZDNlNDExMiJdIHsgZGlzcGxheTogZmxleDsgfSAudGItY29udGFpbmVyIC50Yi1jb250YWluZXItaW5uZXJ7d2lkdGg6MTAwJTttYXJnaW46MCBhdXRvfSAudGItaW1hZ2V7cG9zaXRpb246cmVsYXRpdmU7dHJhbnNpdGlvbjp0cmFuc2Zvcm0gMC4yNXMgZWFzZX0ud3AtYmxvY2staW1hZ2UgLnRiLWltYWdlLmFsaWduY2VudGVye21hcmdpbi1sZWZ0OmF1dG87bWFyZ2luLXJpZ2h0OmF1dG99LnRiLWltYWdlIGltZ3ttYXgtd2lkdGg6MTAwJTtoZWlnaHQ6YXV0bzt3aWR0aDphdXRvO3RyYW5zaXRpb246dHJhbnNmb3JtIDAuMjVzIGVhc2V9LnRiLWltYWdlIC50Yi1pbWFnZS1jYXB0aW9uLWZpdC10by1pbWFnZXtkaXNwbGF5OnRhYmxlfS50Yi1pbWFnZSAudGItaW1hZ2UtY2FwdGlvbi1maXQtdG8taW1hZ2UgLnRiLWltYWdlLWNhcHRpb257ZGlzcGxheTp0YWJsZS1jYXB0aW9uO2NhcHRpb24tc2lkZTpib3R0b219LnRiLWdyaWQsLnRiLWdyaWQ+LmJsb2NrLWVkaXRvci1pbm5lci1ibG9ja3M+LmJsb2NrLWVkaXRvci1ibG9jay1saXN0X19sYXlvdXR7ZGlzcGxheTpncmlkO2dyaWQtcm93LWdhcDoyNXB4O2dyaWQtY29sdW1uLWdhcDoyNXB4fS50Yi1ncmlkLWl0ZW17YmFja2dyb3VuZDojZDM4YTAzO3BhZGRpbmc6MzBweH0udGItZ3JpZC1jb2x1bW57ZmxleC13cmFwOndyYXB9LnRiLWdyaWQtY29sdW1uPip7d2lkdGg6MTAwJX0udGItZ3JpZC1jb2x1bW4udGItZ3JpZC1hbGlnbi10b3B7d2lkdGg6MTAwJTtkaXNwbGF5OmZsZXg7YWxpZ24tY29udGVudDpmbGV4LXN0YXJ0fS50Yi1ncmlkLWNvbHVtbi50Yi1ncmlkLWFsaWduLWNlbnRlcnt3aWR0aDoxMDAlO2Rpc3BsYXk6ZmxleDthbGlnbi1jb250ZW50OmNlbnRlcn0udGItZ3JpZC1jb2x1bW4udGItZ3JpZC1hbGlnbi1ib3R0b217d2lkdGg6MTAwJTtkaXNwbGF5OmZsZXg7YWxpZ24tY29udGVudDpmbGV4LWVuZH0gLndwLWJsb2NrLXRvb2xzZXQtYmxvY2tzLWdyaWQudGItZ3JpZFtkYXRhLXRvb2xzZXQtYmxvY2tzLWdyaWQ9IjRiNTVhZGYxZDMzMWY0OTZmOGEzYjc5YmM1OTAwNzMwIl0geyBncmlkLXRlbXBsYXRlLWNvbHVtbnM6IG1pbm1heCgwLCAxZnIpO2dyaWQtYXV0by1mbG93OiByb3cgfSAud3AtYmxvY2stdG9vbHNldC1ibG9ja3MtZ3JpZC50Yi1ncmlkW2RhdGEtdG9vbHNldC1ibG9ja3MtZ3JpZD0iNGI1NWFkZjFkMzMxZjQ5NmY4YTNiNzliYzU5MDA3MzAiXSAgPiAudGItZ3JpZC1jb2x1bW46bnRoLW9mLXR5cGUoMW4rMSkgeyBncmlkLWNvbHVtbjogMSB9IC53cC1ibG9jay10b29sc2V0LWJsb2Nrcy1ncmlkLWNvbHVtbi50Yi1ncmlkLWNvbHVtbltkYXRhLXRvb2xzZXQtYmxvY2tzLWdyaWQtY29sdW1uPSI2ZTA4ZDFmNmQzY2M4MTc0M2JkZDA2Y2I4ZjhjYmUzYiJdIHsgZGlzcGxheTogZmxleDsgfSAudGItY29udGFpbmVyIC50Yi1jb250YWluZXItaW5uZXJ7d2lkdGg6MTAwJTttYXJnaW46MCBhdXRvfSAgLnRiLWltYWdle3Bvc2l0aW9uOnJlbGF0aXZlO3RyYW5zaXRpb246dHJhbnNmb3JtIDAuMjVzIGVhc2V9LndwLWJsb2NrLWltYWdlIC50Yi1pbWFnZS5hbGlnbmNlbnRlcnttYXJnaW4tbGVmdDphdXRvO21hcmdpbi1yaWdodDphdXRvfS50Yi1pbWFnZSBpbWd7bWF4LXdpZHRoOjEwMCU7aGVpZ2h0OmF1dG87d2lkdGg6YXV0bzt0cmFuc2l0aW9uOnRyYW5zZm9ybSAwLjI1cyBlYXNlfS50Yi1pbWFnZSAudGItaW1hZ2UtY2FwdGlvbi1maXQtdG8taW1hZ2V7ZGlzcGxheTp0YWJsZX0udGItaW1hZ2UgLnRiLWltYWdlLWNhcHRpb24tZml0LXRvLWltYWdlIC50Yi1pbWFnZS1jYXB0aW9ue2Rpc3BsYXk6dGFibGUtY2FwdGlvbjtjYXB0aW9uLXNpZGU6Ym90dG9tfS53cC1ibG9jay10b29sc2V0LWJsb2Nrcy1ncmlkLWNvbHVtbi50Yi1ncmlkLWNvbHVtbltkYXRhLXRvb2xzZXQtYmxvY2tzLWdyaWQtY29sdW1uPSIxNGViNTk4YzQ1NzM5MzZjNjFkNDQxNTlkNWVlYTQ0MiJdIHsgZGlzcGxheTogZmxleDsgfSAudGItZmllbGRzLWFuZC10ZXh0W2RhdGEtdG9vbHNldC1ibG9ja3MtZmllbGRzLWFuZC10ZXh0PSIwNWM3MTJhNWEyMmI1OWRmMWJlNGQyODQ4NzA1ZDMzNSJdIHsgZm9udC1zaXplOiAyNHB4O2xpbmUtaGVpZ2h0OiAzMnB4OyB9IC50Yi1maWVsZHMtYW5kLXRleHRbZGF0YS10b29sc2V0LWJsb2Nrcy1maWVsZHMtYW5kLXRleHQ9IjA1YzcxMmE1YTIyYjU5ZGYxYmU0ZDI4NDg3MDVkMzM1Il0gcCB7IGZvbnQtc2l6ZTogMjRweDtsaW5lLWhlaWdodDogMzJweDsgfSAudGItY29udGFpbmVyIC50Yi1jb250YWluZXItaW5uZXJ7d2lkdGg6MTAwJTttYXJnaW46MCBhdXRvfWgxLnRiLWhlYWRpbmdbZGF0YS10b29sc2V0LWJsb2Nrcy1oZWFkaW5nPSI3ODJkMWZhOGI4NjdjZWUzZTI2OTc4MTdlMTg3MmFkYSJdICB7IGZvbnQtc2l6ZTogNDhweDtsaW5lLWhlaWdodDogNDBweDsgfSAgLnRiLWNvbnRhaW5lciAudGItY29udGFpbmVyLWlubmVye3dpZHRoOjEwMCU7bWFyZ2luOjAgYXV0b30gfSA=
Even more intriguing is the fact that the water we drink was most likely created during the explosions of huge stars billions of years ago. Next time you take a sip of water, remind yourself that the very substance you are sipping on was created in space long before even Earth was around. Kind of makes you feel a bit humbled…
Water- Water Everywhere- But Not a Drop to Drink…
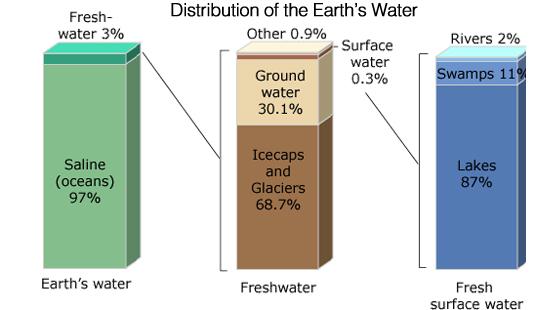
We are so used to having water in all aspects of our daily lives that many of us take it for granted. And yet, in spite of the fact that over 70% of our planet’s surface is covered by water, hardly any of these water resources can be used to meet our needs. Of all of Earth’s water, over 97% is saltwater, which is great for sailors but doesn’t taste too good and in fact would be deadly if you relied on it to meet your thirst. Of the tiny little bit that is freshwater, about 2.5%, most of that water is locked up in ice caps and glaciers, or is stored deep underground. It turns out that less than 1% of Earth’s water is accessible to us as freshwater.
Source credit: Igor Shiklomanov’s chapter “World fresh water resources” in Peter H. Gleick (editor 1993, Water in Crisis: A Guide to the World’s Fresh Water Resources. Note: Numbers are rounded, so percent summations may not add to 100.
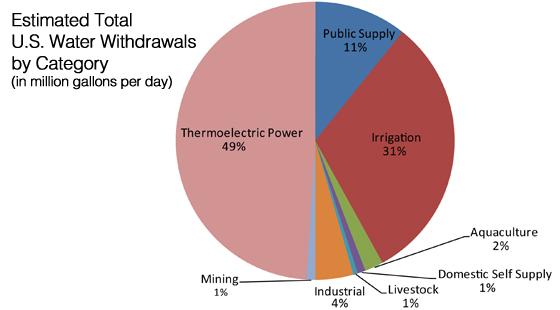
How We Use Freshwater Resources
It might also surprise you to find out what we use freshwater resources for here in the United States- most of our freshwater resources are used to generate electricity! The graph below depicts the various ways that freshwater resources are used in industrialized countries. You can also see a short video called “Show Me the Water ” to learn more.
Source credit: American Geosciences Institute, from data by the USGS
As most of the accessible freshwater to meet our needs comes from precipitation, it is vital that we have an understanding of how much precipitation is falling all over the world. That is why NASA, in cooperation with Japan’s Aerospace Exploration Agency, JAXA, recently launched a new Earth-observing mission called “Global Precipitation Measurement”, or “GPM”. This new satellite is enabling us to measure precipitation all over the globe and to update that data every three hours.
Why on Earth would we measure precipitation from SPACE?
Before getting into the nuts and bolts to explain how this is possible, let’s begin by looking at why we need to measure Earth’s precipitation from space. Although we are able to accurately measure how much precipitation is falling using rain gauges and radar instrumentation from the ground, we can only use these tools in locations that have the technology and expertise to collect these measurements. Rain gauges need to be in locations where they can be emptied at the same time each day, making certain locations impossible to collect data from regularly. It turns out that if you were to gather up all the rain gauges from around the world and put them in the same place, they would take the space of only two basketball courts. And while radar instruments that measure precipitation can extend a few miles out over the ocean to collect data, most of the globe does not have sufficient ground instrumentation to accurately measure how much precipitation is falling to Earth. That is why we need to be off Earth’s surface, looking down through the clouds, to accurately measure how much precipitation is falling.
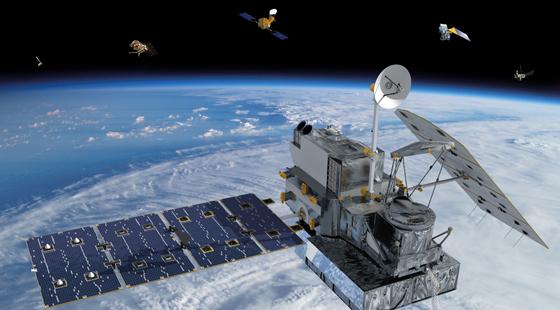
The GPM Core Observatory Photo credit: NASA/GPM
The Global Precipitation Measurement Mission
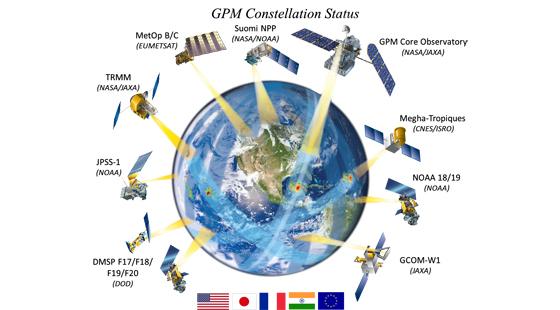
The GPM satellite flies about 250 miles above Earth’s surface, collecting detailed measurements with its two main instruments- the Dual-frequency Precipitation Radar (DPR) and the GPM Microwave Imager (GMI). The DPR works like a CAT scan- the active radar sends out a pulse of energy that hits the precipitation particles inside clouds and then the pulse bounces back from the particles to a sensor that reads the information. Using this instrument, we can determine what size, type, and how much of different precipitation particles exist in the atmosphere — in three dimensions. The other instrument is the GPM Microwave Imager (GMI); it acts like an x-ray. It measures energy that naturally radiates from the precipitation particles. Based on the energy, it can tell the difference between light rain, heavy rain and falling snow and ice. Together, both instruments can tell us what is inside of a cloud. Then, algorithms—a step-by-step way to solve a math problem; or a process (similar to a recipe) for a computer to follow— are used to convert the information from the satellite instruments into precipitation data. The precipitation data can then be compared to ground-based information that comes from rain gauges and radar around the world. There are ten other satellites with similar instruments that send their data through the GPM Core Observatory, which is what enables us to update the data every three hours to gain a global picture of the amount of precipitation that is falling to Earth. To learn more about this mission, go to http://pmm.nasa.gov .
Illustration of the Global Precipitation Measurement Mission satellite constellation Photo credit: NASA/GPM
To learn more about how this satellite is able to collect, analyze, and share the data, please see any of the following resources:
How Will GPM Help Us Back Here on Earth?
All life as we know it relies on the availability of water. Knowing when, where, and how much it rains or snows is vital to understanding how weather and climate impact our environment. Not only will this data prove extremely useful to meteorologists to aid them in forecasting the weather and better understanding of extreme weather events, but the data is also used to help world health organizations predict and respond to water-borne disease outbreaks; agricultural experts anticipate the availability of water, and allows those who respond to disasters to be on the alert when too much precipitation may result in flooding, landslides, and other natural hazards. In many parts of the world, rain is the only source of water for both drinking water and agriculture. Rain also recharges ground water aquifers, and spring snowmelt replenishes rivers and streams for the summer. Having too much or too little water often results in natural disasters for populations around the world, where tropical cyclones, floods, droughts, and landslides can wreak havoc on local communities. Having accurate information on rain and snow is critical for estimating when to plant crops, where to build houses, how to plan transportation routes, and to what extent we need assistance during extreme weather.
How Does NASA Study our Oceans Health?
Rest assured, NASA is also keeping close tabs on our oceans as we depend on them for our survival as well. Here are just a few of these missions that are currently in operation:
Aqua : “Aqua carries six state-of-the-art instruments to observe the Earth’s oceans, atmosphere, land, ice and snow covers, and vegetation, providing high measurement accuracy, spatial detail, and temporal frequency. This comprehensive approach to data collection enables scientists to study the interactions among the four spheres of the Earth system–the oceans, land, atmosphere, and biosphere.” To learn more, go to http://aqua.nasa.gov
Aquarius : “The Aquarius mission is providing the first global observations of sea surface salinity, giving climatologists a better understanding of the ocean’s role in Earth’s water cycle and weather patterns, as well as global climate change. With sensors that measure sea level, ocean color, temperature, winds, rainfall and evaporation, Aquarius, the NASA-built primary instrument will offer a much clearer picture of how the ocean works, how it is linked to climate and how it may respond to climate change.” To learn more, go to http://aquarius.nasa.gov
Jason-2/OSTM : “This satellite altimetry mission provides sea surface heights for determining ocean circulation, climate change and sea-level rise. Earth’s oceans are the greatest influence on global climate. Only from space can we observe our vast oceans on a global scale and monitor critical changes in ocean currents and heat storage. Continuous data from satellites like TOPEX/Poseidon and Jason help us understand and foresee the effects of the changing oceans on our climate and on catastrophic climate events such as El Niño and La Niña. To learn more, go to http://sealevel.jpl.nasa.gov/overview/